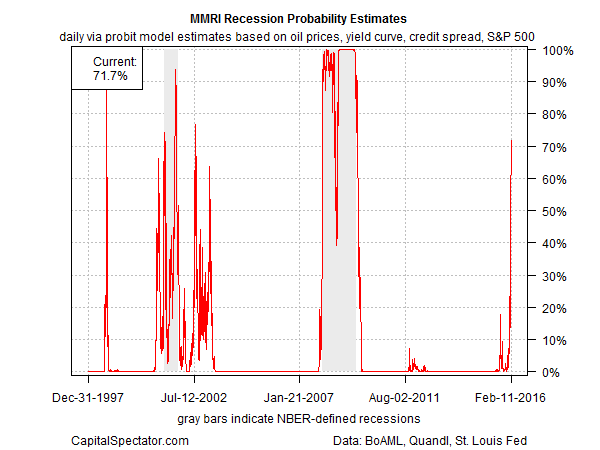
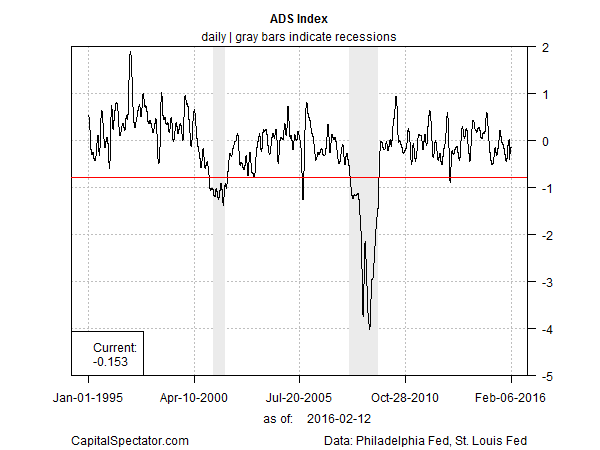
The battle between macro and markets rages on. Yesterday’s update of the ADS Index—a US business-cycle metric published by the Philadelphia Fed—remained comfortably in growth territory, in part due to yesterday’s upbeat report on jobless claims (one of the index’s six components). A markets-based estimate of the US economic trend, by contrast, continues to price in a new recession, based on the Macro-Markets Risk Index (MMRI), which aggregates four corners of the financial and commodities realm in an effort to gauge the crowd’s outlook. (See here for MMRI’s design details.)
The standoff leaves investors with a difficult question: embrace the market’s grim forecast or reserve judgment and wait for confirmation—or rejection—via the hard economic data? Most of the time the two sides of this coin are in alignment. But current conditions have dispensed an awkward state of affairs. Indeed, the MMRI’s implied recession probability via a probit model ticked higher yesterday, reaching nearly 72%–the loftiest reading since 2009, when the previous downturn was winding down.
History shows, however, that market-based estimates of recession risk can be wrong. Markets go into hissy fits for a variety reasons, and so it’s always unclear in real time if the return of dark signals in the crowd’s composite pricing preferences are a warning sign for the economy overall or a lesser evil.
The Philly Fed’s ADS Index continues to favor the latter view. Indeed, boosted by the latest decline in the weekly jobless claims data the current ADS value stands at roughly -0.15. That’s still well above the -0.80 reading (horizontal red line in chart below) that’s considered an “optimal recession threshold), based on a study by the San Francisco Fed (“Diagnosing Recessions”). By that standard, there’s still a comfortable margin between current levels of US economic activity and the tipping point for the ADS Index that marks the start of a new recession.
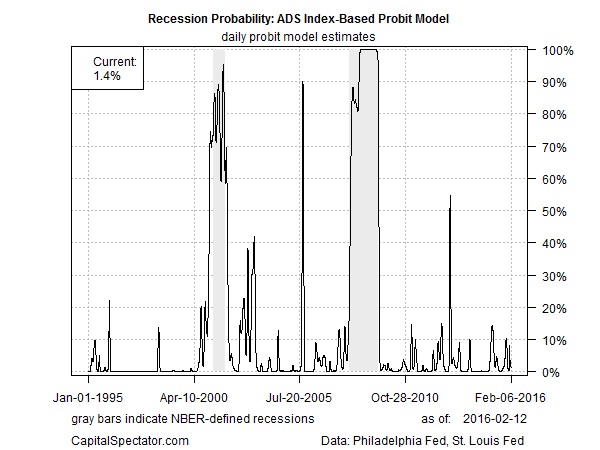
Translating the raw ADS data into recession-probability estimates via a probit model also translates into a low-risk reading at the moment–a mere 1.4%, based on economic data for the period through Feb. 6.
It’s a different story via a markets-based lens, due mostly to two of four MMRI components: plunging equity prices and the rising high-yield spread. By contrast, the Treasury yield curve is still positively sloped, albeit in a diminishing degree of late. Meanwhile, the tumble in crude oil prices is still considered a net plus for the economy, or so the long sweep of history suggests.
In any case, the current climate is a bit of a gray area and so it’s all about the hard economic numbers from this point on. We’ve been here before. In late-2007 and early 2008, the market signals were sensing danger but it wasn’t until late in 2008’s first quarter at the earliest that analysts could make a high-confidence call that a new recession had started based on formal economic data. The vintage reading of the three-month average of the Chicago Fed’s National Activity Index for February 2008, for instance, signaled a new recession when the numbers were updated on March 24 of that year.
It’s anyone’s guess at this stage if the market’s current recession forecast is signal or noise. There’s certainly scope for doubt for assuming the worst, based on the available economic numbers in hand. The problem, of course, is that hard macro data arrives with a lag and so we’re left with a difficult if not impossible choice. The solution, of course, is more data—economic data in particular. All may become clear in a week or two, although don’t discount the possibility that the hazy state of affairs could roll on for another month… or two?!?!.
Meantime, let’s keep reminding ourselves of a salient fact: every US recession has been accompanied by a plunging stock market but not every stock-market plunge has been accompanied by an NBER-defined recession. Until further notice, however, deciding which scenario applies to the here and now is a thankless task.


