Economic growth in Philippines has been impressive in the second quarter of 2017. Per the National Statistics Agency, GDP grew 6.5% year over year in the second quarter compared with 6.4% in the first quarter. It also beat a Reuters forecast of 6.2% (read: EM ETFs: What You Need to Know Before Investing).
Government spending was a major contributor to the increase in GDP. It edged up to 7.1% in the second quarter from a meager 0.1% in the first quarter, said Economic Planning Secretary Ernesto Pernia. He also expects to achieve the 6.5–7.5% growth target for this year quite easily.
Per Washington Post, among the sectors, the fastest growth recorded was by Industry, at 7.3%. Agriculture increased 6.3% in the quarter and Services slowed 6.1%.
Foreign investment plays an integral role in determining the economy’s success. However, President Rodrigo Duterte's deadly war on drugs may cause foreign investors to flee. Most recently, Philippine police killed 32 people in a series of drug raids. This war against drugs has made the economic environment in the country quite uncertain.
Philippines Central Bank Governor, Nestor Espenilla kept the interest rate unchanged in the latest policy decision meeting on August 10, 2017. However, he stated that they are open to hiking rates if they see that the economy is growing too fast, which is currently not the case.
Moreover, Philippines President Rodrigo Duterte’s tax reform bill was passed by the lower house of the parliament after the third and final reading in June. The bill is expected to give a boost to tax revenue in order to fund Duterte’s infrastructure expansion goals. The administration has promised to increase infrastructure spending to 7.4% of GDP by 2020 (read: Philippines Tax Reform Bill Passed: ETFs in Focus).
Although the bill has been passed in the house, there is still high uncertainty regarding the final bill being passed in due course by the senate. The administration targets to implement this new tax system in 2018. Under the new system, the revenue foregone owing to lower corporate taxes will be compensated by higher excise levies on oil, automobiles, beverages etc.
This has given a boost to the consumers’ confidence in the economy. Consumer Confidence in Philippines increased to an all-time high of 13.1 in the second quarter of 2017 from 8.7 in the previous quarter.
Let us now discuss the most popular ETF focused on providing exposure to Philippine equities.
iShares MSCI Philippines ETF EPHE
This fund seeks to provide exposure to Philippine stocks primarily in the large cap segment.
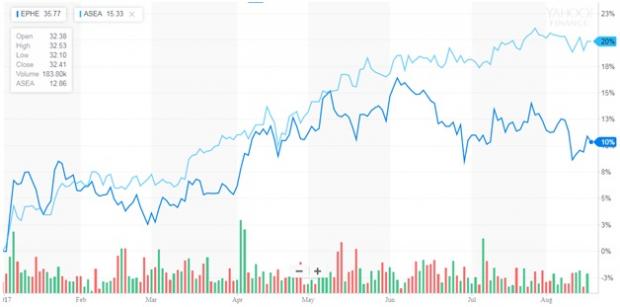
It has AUM of $183.61 million and charges a fee of 64 basis points a year. From a sector look, Real Estate, Financials and Industrials are the top three allocations of the fund, with 24.39%, 23.44% and 23.24% exposure, respectively (as of August 15, 2017). Ayala Land Inc, SM Prime Holdings Inc and BDO Unibank Inc are the top three holdings of this fund, with 9.75%, 9.35% and 7.92% exposure, respectively (as of August 15, 2017). The fund has returned 10.92% year to date but lost 10.21% in the last one year (as of August 16, 2017). It currently has a Zacks ETF Rank #3 (Hold) with a Medium risk outlook.
We will now compare the fund’s performance to a broader South East Asia based ETF, ASEA.
Global X Southeast Asia ETF ASEA
This fund provides broad exposure to the five members of the Association of Southeast Asian Nations, Singapore, Indonesia, Malaysia, Thailand, and the Philippines. It is appropriate for investors looking for a diversified exposure to South East Asia (read: Indonesia's GDP Growth Misses Expectations: ETFs in Focus).
ASEA is less popular with AUM of $13.8 million and charges a fee of 65 basis points a year. From a geographical perspective, the fund has 30.45% exposure to Singapore, 22.29% to Malaysia, 21.15% to Thailand, 19.67% to Indonesia and 6.44% to Philippines (as of June 30, 2017). Financials, Telecommunication Services and Industrials are the top three sectors of the fund, with 45.92%, 14.94% and 8.12% allocation, respectively (as of June 30, 2017). Oversea-Chinese Banking Ltd, DBS Group Holdings Ltd and United Overseas Bank Ltd are the top three holdings of the fund, with 7.29%, 7.25% and 5.99% allocation, respectively. The fund has returned 6.82% in the last one year and 19.20% year to date (as of August 16, 2017). ASEA currently has a Zacks Rank #3 with a Medium risk outlook.
Below is a chart comparing the year-to-date performance of the two funds.

Source: Yahoo (NASDAQ:AABA) Finance
Want key ETF info delivered straight to your inbox?
Zacks’ free Fund Newsletter will brief you on top news and analysis, as well as top-performing ETFs, each week. Get it free >>
ISHARS-MS PHILP (EPHE): ETF Research Reports
GLBL-X SE ASIA (ASEA): ETF Research Reports
Original post
Zacks Investment Research
