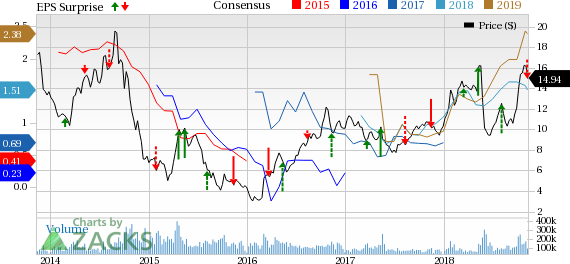
Brazil's state-run energy giant Petroleo Brasileiro S.A., or Petrobras (NYSE:PBR) announced third-quarter earnings per ADS of 26 cents, missing the Zacks Consensus Estimate of 35 cents. The weaker-than-expected results can be attributed to lower oil and gas production and higher spending.
However, the bottom line was significantly higher than the year-earlier quarter’s profit of 2 cents, boosted by a rise in the price of oil. Net quarterly profit soared to R$6.6 billion from a mere R$266 million, while adjusted EBITDA also rose to R$29.9 billion from R$19.2 billion a year ago.
The troubled national oil company’s net operating revenues of $24.9 billion was ahead of the year-earlier sales of $22.7 billion and beat the Zacks Consensus Estimate of $24.5 billion.
Let's take a deeper look at the recent performances from the company's two main segments: Upstream (Exploration & Production) and Downstream (or Refining, Transportation and Marketing).
Upstream: The Rio de Janeiro-headquartered company’s total oil and gas production during the third quarter reached 2,514 thousand barrels per day (Mbbl/d) – 80% liquids – down from 2,749 Mbbl/d in the same period of 2017.
Compared with the third quarter of 2017, Brazilian oil and natural gas production – constituting 95% of the overall output – decreased 9.1% to 2,399 Mbbl/d.
In the Jul to Sep period, the average sales price of oil in Brazil jumped 45.2% from the year-earlier period to $70.13 per barrel. This enabled Petrobras' upstream unit to earn R$18.3 billion in the quarter, a massive improvement from the R$6.3 billion income in the year-earlier period.
Downstream: During the third quarter, Petrobras' downstream unit earned R$4.6 billion, up 28.2% from the year-earlier period figure of R$3.6 billion. The increase reflects higher oil products sales margins.
Costs: During the period, Petrobras’ sales, general and administrative expenses stood at $560 million, 27.6% lower than the year-ago period. However, selling expenses rose by 11.5% to $1.5 billion.
Financial Position: During the three months ended Sep 30, 2018, Petrobras’ capital investments and expenditures totaled R$13.9 billion, 47.8% higher than the R$9.4 billion incurred in the year-ago period. The hike in capital spending reflects an attempt by the company to reverse the declining production trend.
Notably, the company’s third-quarter 2018 financial statement incorporated the $853.2 million (around R$3.6 billion) payment to the government bodies of Brazil and United States to settle the long-running Lava Jato (Car Wash) scandal investigation.
As a result, free cash flow only came in at R$8.1 billion for the quarter, down 44.9% year over year
Nevertheless, the world's most indebted oil company managed to trim its massive leverage and lower its net debt to EBITDA ratio to 2.96 from 3.23 in the previous quarter, moving toward the year-end goal of 2.5.
At the end of the Sep 2018, the company had net debt of $72.9 billion, decreasing from the $84.9 billion at the end of 2017 and $96.4 billion as of Dec 31, 2016. Net debt-to-capitalization ratio was 50%, down from 51% nine months ago. Additionally, Petrobras finished the third quarter with cash and cash equivalents of $14.2 billion.
Zacks Rank & Stock Picks
Petrobras currently retains a Zacks Rank #3 (Hold).
Some better-ranked players in the energy space are Bonanza Creek Energy, Inc. (NYSE:BCEI) , Magnolia Oil & Gas Corporation (NYSE:MGY) and Murphy Oil Corporation (NYSE:MUR) . Bonanza Creek Energy carries a Zacks Rank #1 (Strong Buy), while Magnolia Oil & Gas and Murphy Oil have a Zacks Rank #2 (Buy).
(You can see the complete list of today’s Zacks #1 Rank (Strong Buy) stocks here.)
Bonanza Creek’s earnings beat the Zacks Consensus Estimate in three of the last four quarters, the average positive surprise being 74.9%.
Murphy Oil’s earnings also beat the Zacks Consensus Estimate in three of the last four quarters, the average positive surprise being 76.2%.
Meanwhile, over 30 days, Magnolia Oil & Gas has seen the Zacks Consensus Estimate for 2018 and 2019 increase 19.1% and 8.8%, to $1.37 and $1.74 per share, respectively.
The Hottest Tech Mega-Trend of All
Last year, it generated $8 billion in global revenues. By 2020, it's predicted to blast through the roof to $47 billion. Famed investor Mark Cuban says it will produce "the world's first trillionaires," but that should still leave plenty of money for regular investors who make the right trades early.
See Zacks' 3 Best Stocks to Play This Trend >>
Petroleo Brasileiro S.A.- Petrobras (PBR): Free Stock Analysis Report
Bonanza Creek Energy, Inc. (BCEI): Free Stock Analysis Report
Murphy Oil Corporation (MUR): Free Stock Analysis Report
Magnolia Oil & Gas Corp (MGY): Free Stock Analysis Report
Original post
Zacks Investment Research

