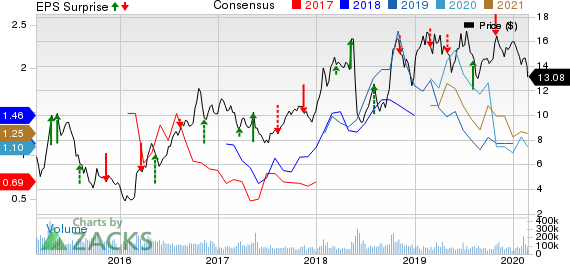
Brazil's state-run energy giant Petroleo Brasileiro S.A., or Petrobras (NYSE:PBR) announced fourth-quarter earnings per ADS of 30 cents, missing the Zacks Consensus Estimate of 37 cents. The unfavorable comparison stems from lower average realized commodity prices and increase in sales and administrative expenses.
However, the bottom line compared favorably with the year-earlier quarter’s income of 8 cents per ADS, boosted by impressive production growth and lower lifting costs. Adjusted EBITDA rose to $8,878 million from $7,659 million a year ago.
Meanwhile, the company’s revenues of $19,868 million went past the Zacks Consensus Estimate of $19,476 million but fell from the year-earlier sales of $21,736 million.
Let's take a deeper look at the recent performances from the company's two main segments: Upstream (Exploration & Production) and Downstream (or Refining, Transportation and Marketing).
Upstream: The Rio de Janeiro-headquartered company’s average oil and gas production during the fourth quarter reached 3,025 thousand barrels of oil equivalent per day (MBOE/d) – 79% liquids – up from 2,660 MBOE/d in the same period of 2019. In fact, it was the first time that volumes exceeded 3,000 MBOE/d
Compared with the fourth quarter of 2018, Brazilian oil and natural gas production – constituting 97% of the overall output – increased 14.5% to 2,938 MBOE/d. The improvement was driven by ramp-up of new projects that began operations in 2018 and 2019.
For the twelve months ended Dec 31, 2019, average production rose 5.4% from 2018 levels to 2,770 MBOE/d.
In the October to December period, the average sales price of oil in Brazil fell 5.6% from the year-earlier period to $63 per barrel. While the falling crude prices had a negative effect on upstream segment earnings, it was more than offset by higher production. A tight leash on pre-salt lifting costs, which fell 20.2% from the fourth quarter of 2018 to $5.02 per barrel, also provided support.
Overall, the segment’s revenues edged up to $13,868 million in the quarter under review from $13,333 million in the year-ago period. Moreover, profits rose to $3,440 million from the fourth-quarter 2018 income of $2,296 million.
Downstream: Revenues from the segment totaled $17,606 million, lower than the year-ago figure of $18,929 million. Nevertheless, Petrobras' downstream earnings of $108 million turned around from the year-ago loss of $870 million, primarily due to favorable inventory turnover effects. Higher exports, improved crack spreads and lower natural gas prices (used as a refining input) also helped results.
Costs
During the period, Petrobras’ sales, general and administrative expenses stood at $1,880 million, doubling from the year-ago period. Selling expenses also shot up significantly – from $369 million to $1,386 million. Consequently, total operating expenses rose by 7.8% year over year to $5,358 million.
Financial Position
During the three months ended Dec 31, 2019, Petrobras’ capital investments and expenditures (including signing bonus of $16,671 million) totaled $19,838 million, compared with $3,326 million (including signing bonus of $3,308 million) in the prior-year quarter. In 2019, the company spend $27,413 million.
Importantly, the company generated positive free cash flow for the 19th consecutive quarter, with the metric surging to $5,650 million from $4,262 million recorded in last year’s corresponding period. For the full-year 2019, free cash flow was up 20.5% to $18,376 million.
At the end of 2019, Petrobras had a net debt of $78,861 million, increasing from $69,378 million a year ago and $75,419 million as of Sep 30, 2019. The company ended the year with cash and cash equivalents of $7,377 million.
Meanwhile, Petrobras’ net debt to trailing twelve months EBITDA ratio worsened to 2.41 from 2.20 in the previous year.
Zacks Rank & Stock Picks
Petrobras holds a Zacks Rank #2 (Buy).
Apart from Petrobras, investors interested in the energy space might look at other options like Chevron (NYSE:CVX) , Marathon Oil (NYSE:MRO) and Hess Corporation (NYSE:HES) – all carrying a Zacks Rank #2 as well.
You can see the complete list of today’s Zacks #1 Rank (Strong Buy) stocks here.
The 2020 Zacks Consensus Estimate for Chevron indicates 12.8% earnings per share growth from 2019 level.
Marathon Oil has surpassed estimates in three of the last four quarters, the average being 190.8%
The 2020 Zacks Consensus Estimate for Hess indicates 93.7% earnings per share growth from 2019 level.
The Hottest Tech Mega-Trend of All
Last year, it generated $24 billion in global revenues. By 2020, it's predicted to blast through the roof to $77.6 billion. Famed investor Mark Cuban says it will produce "the world's first trillionaires," but that should still leave plenty of money for regular investors who make the right trades early.
See Zacks' 3 Best Stocks to Play This Trend >>
Marathon Oil Corporation (MRO): Free Stock Analysis Report
Petroleo Brasileiro S.A.- Petrobras (PBR): Free Stock Analysis Report
Chevron Corporation (CVX): Free Stock Analysis Report
Hess Corporation (HES): Free Stock Analysis Report
Original post

