Last week I penned Income Improving Nicely - Expenditures Not. Maybe Personal Debt Is Becoming Too Large. This post was silent on other reasons which could be causing sluggish spending growth.
Follow up:
There are a variety of reasons for soft spending growth. I believe non-mortgage debt growth is only one of the reasons - as recently credit growth as fueled half of the consumption growth.
But the primary constraint is likely poor income growth. In last week's post:
It seems to me that the average Joe or Jane works within a fairly tight budget - with little month variance in income. In other words, I believe Joe and Jane spend all of their income - about 1/3 of all households in the USA have no savings. and over 40% of all adults do not have $500 in the bank. It is not much of a leap to conclude that the variation in income comes from the higher end of the earnings spectrum. As spending growth is decelerating, I would conclude the richer end of the economy is not spending their riches.
The BEA Disposable Personal Income does not break income down by earnings quartile. But the BLS does give us a window into median earnings.
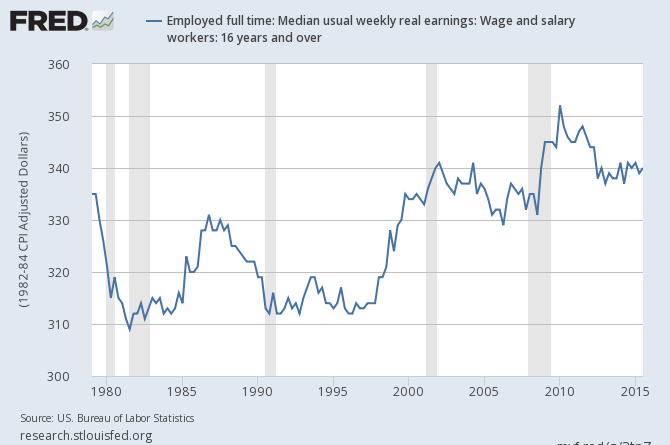
The above graph covers almost 110,000,000 full time workers, and shows very little income growth in the 21st century - not to mention that the NUMBER of full time workers has changed very little from 15 years ago.
The red line in the graph below shows median income from Sentier Research - which correlates to the data from the BLS showing no income growth in the 21st century.
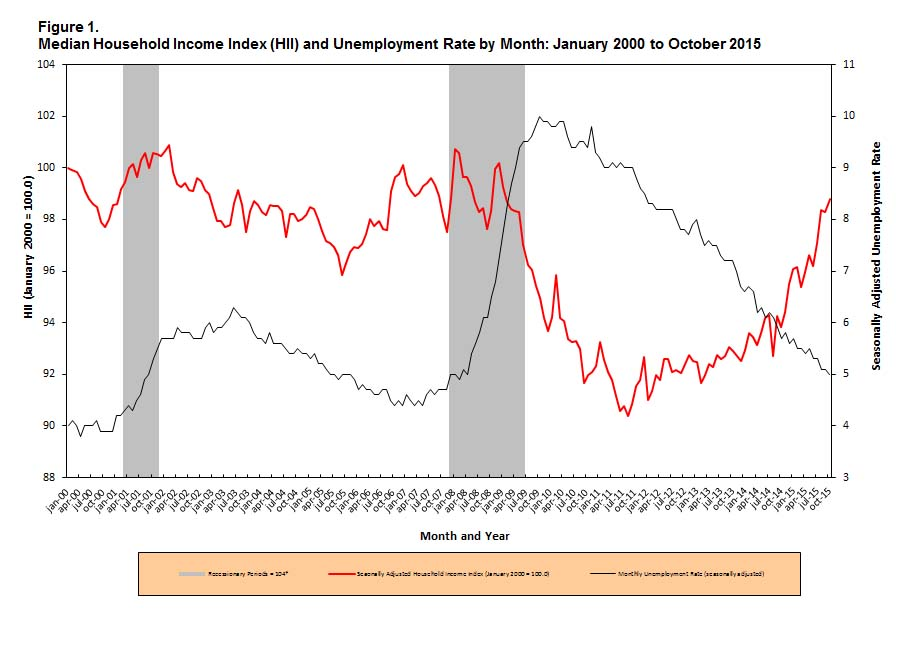
I have written on this subject in the past, and likely will continue to write on this topic in the future. It is obvious that the lower half of the households in the USA have an earnings shortfall. The solution for this is far from obvious.
Left wing pundits want to boost minimum wage to force up earnings on the lowest end of the households. I hope somebody can convince me that this is not a jobs killer - the road to hell is paved with good intentions.
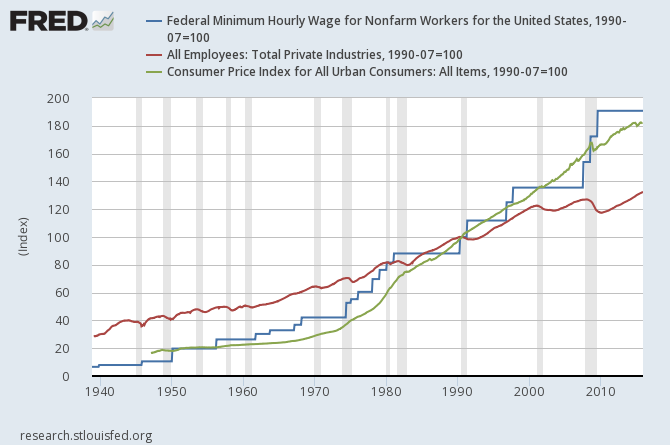
The above graph has been indexed to 1990 = 100 - and shows inflation (green line), minimum wage (blue line), and private employment (red line). There are many dynamics affecting employment levels, and I have not seen any study which breaks down the effects of each of the dynamics. Still, this graph clearly shows that the current minimum wage has kept up with inflation whilst employment levels are nearly flat since 2000. Nothing in the above graph suggests a rise in the minimum wage would put more money into the economy (earnings per worker times number of workers equals earnings contribution).
Right wing pundits want to let the free market take care of household earnings. We have an imbalance currently and doing nothing likely will grow the imbalance (as trends continue until they do not). I dispute the "fact" that the USA has a free market anyway.
Something is wrong. Does the USA needs to build a fence along the Mexican border or send boots to Syria? Politicians concentrate on these issues as they believe they have the weapons to implement their flawed solutions. Is it possible to legislate private sector employment growth?
Other Economic News this Week:
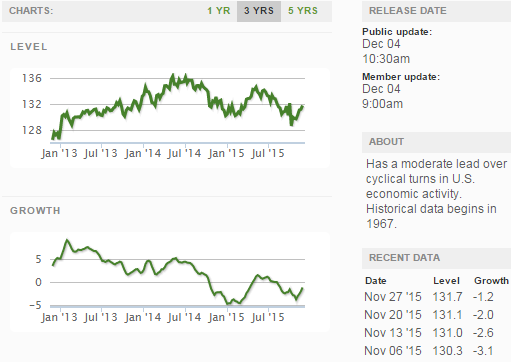
The Econintersect Economic Index for December 2015 declined - and remains in the low range of index values seen since the end of the Great Recession. The most tracked sectors of the economy generally showed some growth. Still our economic index remains in a long term decline since late 2014.
Current ECRI WLI Growth Index
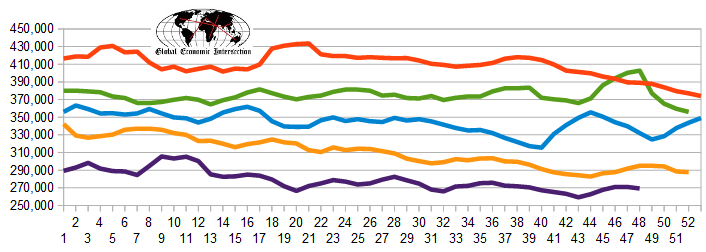
The market (from Bloomberg) was expecting the weekly initial unemployment claims at 266 K to 270 K (consensus 269,000) vs the 269,000 reported. The more important (because of the volatility in the weekly reported claims and seasonality errors in adjusting the data) 4 week moving average moved from 271,000 (reported last week as 271,000) to 269,250. The rolling averages generally have been equal to or under 300,000 since August 2014.
Weekly Initial Unemployment Claims - 4 Week Average - Seasonally Adjusted - 2011 (red line), 2012 (green line), 2013 (blue line), 2014 (orange line), 2015 (violet line)
Bankruptcies this Week:Privately-held FPMC Fort Worth Realty Partners, Offshore Group Investment Limited (OGIL), Axion International Holdings
Click here to view the scorecard table below with active hyperlinks
Weekly Economic Release Scorecard:
