
Perrigo Company plc (NYSE:PRGO) reported third-quarter 2017 adjusted earnings of $1.39 per share, which beat the Zacks Consensus Estimate of $1.10 by 26.4%. The bottom line increased 13% from the year-ago figure.
Net sales in the reported quarter declined 2% to $1.23 billion as divestitures of some businesses hurt the top line. But revenues surpassed the Zacks Consensus Estimate of $1.17 billion.
Excluding the impact of divestitures, sales improved on the back of positive execution across all business segments.
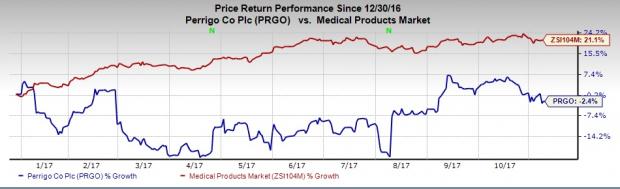
Shares of Perrigo have rallied almost 13% in after-hours trading on the back of the company’s raised guidance. However, the company’s shares have significantly underperformed the industry so far this year. The stock has lost 2.4% versus the broader industry’s gain of 21.1%.
Segment Discussion
Effective from Jan 1, 2017, the company’s new reporting segments are: Consumer Health Care Americas (CHCA), Consumer Health Care International (CHCI) and Prescription Pharmaceuticals (RX).
CHCA: CHCA net sales in the third quarter of 2017 came in at $599 million, down 2% due to sale of the vitamins, minerals and supplements (“VMS”) business in June 2016, which had contributed to segmental sales in the prior year.
However, excluding year-over-year contribution from VMS business, the company witnessed a 1% increase in sales in the reported quarter. This upside can be attributed to a strong performance from the gastrointestinal category, animal health and Mexico businesses compared with the year-ago quarter. New product sales of $13 million were led by the store brand version of Nexium, launched in September.
CHCI: CHCI segment reported net sales of $365 million, down 3% (declined 6% on a constant-currency basis) from the year-ago period. Excluding contributions from the divested European distribution businesses and favorable currency movements, organic net sales increased approximately 5% owing to higher sales of new products.
The company also witnessed higher sales in the allergy, analgesic plus cough and cold categories.
Prescription Pharmaceuticals (RX): The Prescription Pharmaceuticals segment net sales slipped 1% to $251 million on a reported basis and remained flat on a constant-currency basis. This dip in sales can be attributed to lower sales of Entocort due to competitive pressures and price erosion. However, lower sales were partially offset by higher sales of new products.
2017 Earnings Outlook Updated
Perrigo increased its earnings outlook for 2017 because of continued positive execution across all business segments. The company now expects adjusted earnings per share in the range of $4.80-$4.95 compared with $4.45-$4.70, projected previously.
Perrigo Company Price, Consensus and EPS Surprise
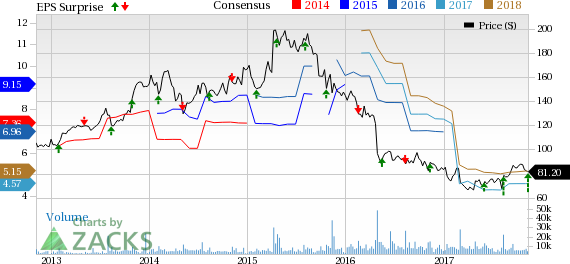
Perrigo Company Price, Consensus and EPS Surprise | Perrigo Company Quote
Zacks Rank & Key Picks
Perrigo carries a Zacks Rank #3 (Hold). Some better-ranked stocks in the health care sector include Emergent Biosolutions, Inc. (NYSE:EBS) , Ligand Pharmaceuticals Inc. (NASDAQ:LGND) and Exelixis, Inc. (NASDAQ:EXEL) . While Ligand sport a Zacks Rank #1 (Strong Buy), Emergent and Exelixis carries a Zacks Rank #2 (Buy). You can see the complete list of today’s Zacks #1 Rank stocks here.
Ligand’s earnings per share estimates have moved up from $3.68 to $3.70 for 2018 over the last 30 days. The company delivered positive earnings surprises in two of the trailing four quarters with an average beat of 6.19%. Share price of the company has surged 44.7% year to date.
Emergent’s earnings per share estimates have moved up from $2.15 to $2.17 for 2018 over the last 60 days. The company came up with positive earnings surprises in three of the trailing four quarters with an average beat of 15.81%. Share price of the company has rallied 24.8% year to date.
Exelixis’ earnings per share estimates have moved up from 62 cents to 70 cents for 2018 over the last 60 days. The company came up with positive earnings surprises in each of the trailing four quarters with an average beat of 572.92%. Share price of the company has soared 77% year to date.
Today's Stocks from Zacks' Hottest Strategies
It's hard to believe, even for us at Zacks. But while the market gained +18.8% from 2016 - Q1 2017, our top stock-picking screens have returned +157.0%, +128.0%, +97.8%, +94.7%, and +90.2% respectively.
And this outperformance has not just been a recent phenomenon. Over the years it has been remarkably consistent. From 2000 - Q1 2017, the composite yearly average gain for these strategies has beaten the market more than 11X over. Maybe even more remarkable is the fact that we're willing to share their latest stocks with you without cost or obligation.
Perrigo Company (PRGO): Free Stock Analysis Report
Exelixis, Inc. (EXEL): Free Stock Analysis Report
Ligand Pharmaceuticals Incorporated (LGND): Free Stock Analysis Report
Emergent Biosolutions, Inc. (EBS): Free Stock Analysis Report
Original post
Zacks Investment Research