[This blog post is an excerpt from a TSI commentary published on 19th July]
Sometimes, financial market relationships that have applied for a very long time stop working. This usually happens because the monetary system undergoes a major change or because the economy is altered in a permanent way by government and/or central bank intervention. It also can happen due to a major technological change that, for example, permanently reduces the demand for a commodity.
As a result of increasing central bank manipulation of money and interest rates, for the past 12 years gold has been getting more expensive relative to commodities that are consumed*. This is because the manipulation has been a) making it more difficult to earn a satisfactory return on investment and b) reducing the appeal of saving in terms of the official money. As central banks reduce the returns available from investing in productive enterprises and punish anyone who chooses to save cash, the demand for a store of value that central banks can’t depreciate naturally rises.
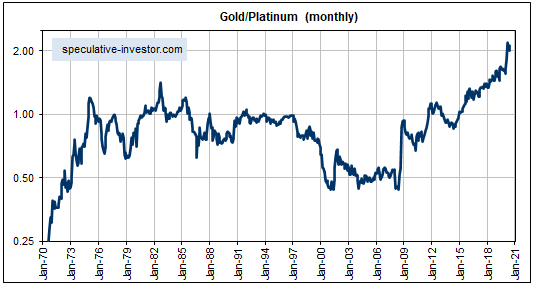
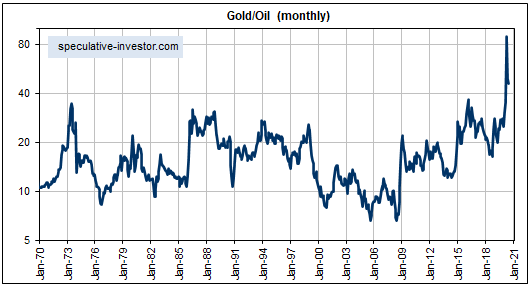
A knock-on effect is that some gold/commodity ratios appear to have been permanently elevated to higher ranges. There still will be periods when gold falls in value relative to these commodities, but the former ceilings no longer apply. In fact, in some cases it may be appropriate to view the former ceilings as the new floors. The two long-term monthly charts displayed below are cases in point.
The first chart shows the gold/platinum ratio. From the early-1970s through to 2015, gold was always near a long-term peak relative to platinum whenever the ratio moved up to 1. However, in 2015 the ratio broke above 1 and continued to trend upward.
A few years ago we speculated that gold/platinum’s former ceiling near 1 had become the new floor, that is, that the gold price would never again make a sustained move below the platinum price. The probability that this has since increased, although it’s likely that gold/platinum made an important high in March-2020 and is in the early stages of a 1-2 year decline.

The second chart shows the gold/oil ratio. From 1970 through to the start of 2020, gold was always near a long-term peak relative to oil whenever the ratio moved up to 30. However, during March-April of this year the gold/oil ratio reached a multiple of its previous long-term peak.
As is the situation with the gold/platinum ratio, it’s likely that the gold/oil ratio is in the process of establishing a higher long-term range that involves the former ceiling (30) being the new floor. As is also the situation with the gold/platinum ratio, it’s a good bet that the gold/oil ratio made an important high in April-2020 and is in the early stages of a 1-2 year decline.

It could be a similar story for the gold/silver ratio, although to a lesser degree. It’s likely that the gold/silver ratio has been permanently elevated, but not to the extent where the former ceiling (80-100) is the new floor. Our guess is gold/silver’s new floor is 50-60.
*That’s right, central banks are inadvertently manipulating the gold price upward, not deliberately manipulating it downward.
