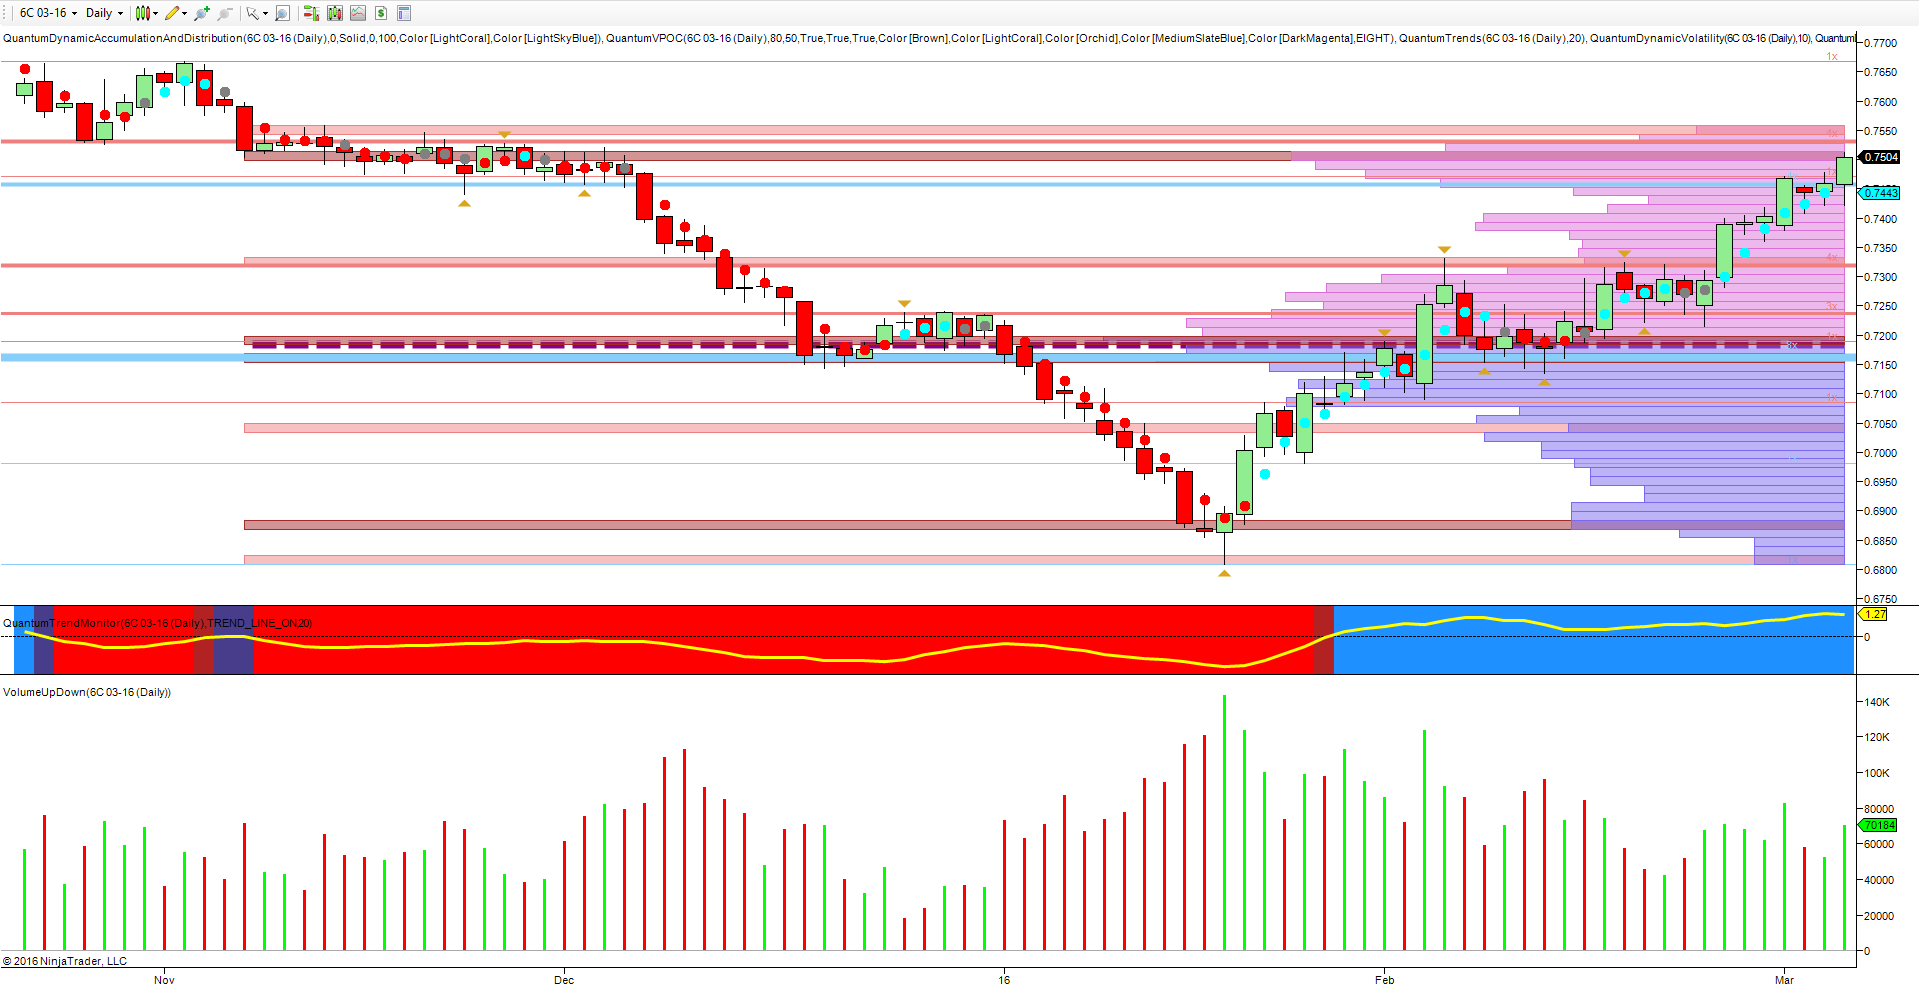
The daily chart of the CAD/USD is one of those examples where the description of technical analysis being an art and not a science, neatly sums up the price action of the last three months with perfect symmetry around the low January 2016. December’s bearish trend with its pause point in the 0.7200 region, followed by the second leg lower to touch a low of 0.6809 in mid January, has since been perfectly mirrored with a consequent rise, back to the congestion region at 0.7200 and a subsequent rally to regain the level of the initial move lower. Perfect symmetry coupled with sustained buying on the 20th January. This type of price action is unusual in the extreme. It is rare to find a rally of this extent from a single candle, simply because the general pattern is for the price action to consolidate first, and then to rally once the selling pressure has been absorbed.
So a wonderful example of art in action on the daily chart, and the question now is whether the picture will be completed with an extended congestion phase at this level and mirroring that to the left of the chart. This now seems likely given we are approaching a high volume node on the volume point of control, and if so art will be repeated.
