PayPal Holdings Inc (NASDAQ:PYPL) is a worldwide online payments company founded 18 years ago. It had its first IPO in 2002 , but in this article we will only be looking at the technical picture for PYPL since its second IPO 2 years ago which valued the company at $46.6 billion. So with the only data available since 2015, we need to present the current different structures that can be labeled in the daily chart and then make a path accordingly.
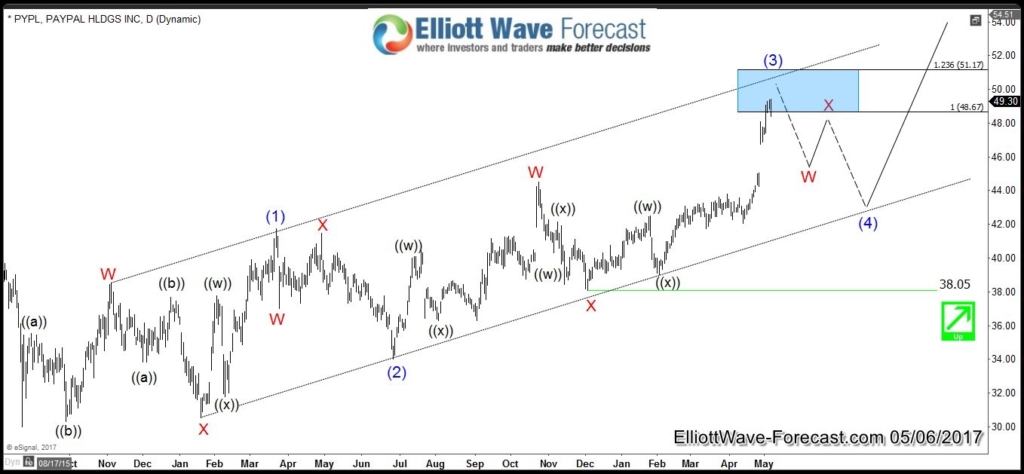
Paypal Diagonal Structure
Looking for a clean 5 waves move is hard these days but switching to the leading diagonal is an easy choice as corrective 3 waves structure is filling the charts. So accordingly , PYPL can be ending the cycle from 2016 low around equal legs area 48.67 – 51.17 as wave (3) without divergence before a 3 waves pullback can take place. Paypal wave (4) should remain within the bullish channel and the pivot at 38 low needs to remain in place for the stock to be able to resume the rally for new highs after ending the correction.

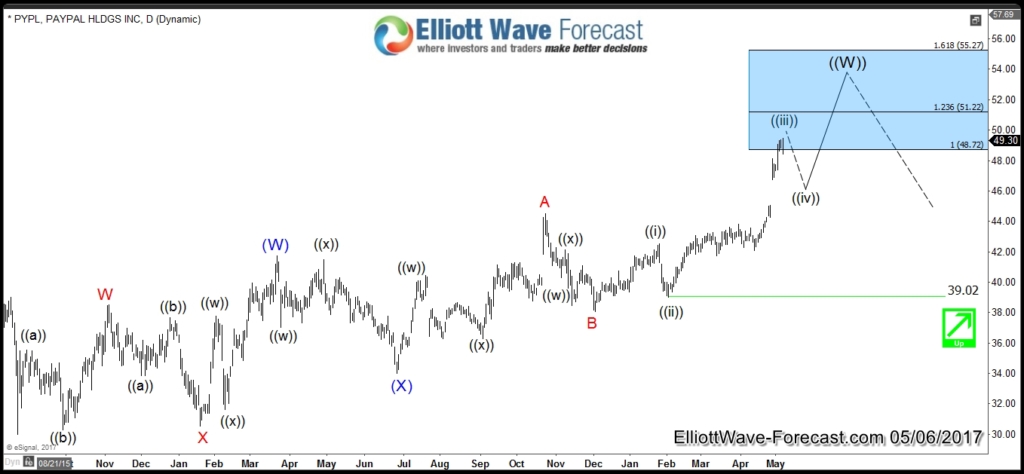
Paypal Double Three Structure
Using 2016 correction as a connector , we can label PYPL as a 7 swings structure from August 2015 low which already reached the extreme area and currently entering equal legs 48.72 area from June 2016 low. The bullish cycle will remain alive as long as pivot at 39.02 low is holding which means the stock can ideally do a short term 3 waves pullback in wave ((iv)) of C before a final thrust higher toward 51.22 – 55.27 area. There PYPL should be ending the whole cycle from 2015 low and a larger pullback can take place.

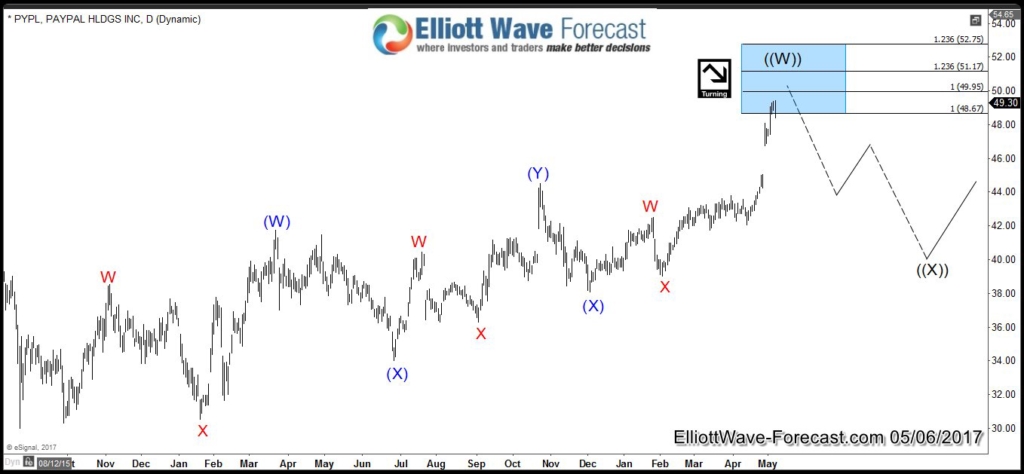
Paypal Triple Three Structure
PYPL can also be counted as 9 swings structure if we use double connectors supported by oscillations, so the stock is then entering the target area for wave (Z) = wave (Y) = wave (W) around 48.67 – 52.75 area and will be then ending the cycle from 2015 low . So it will be the same result as mentioned in the case of the double three structure which is a big correction in wave ((X)).

Market condition have changed during the recent decades and every analyst / trader needs to adapt to the new conditions to have a clear path. One of the observation that we came across in EWF is that markets can be trending higher or lower in series of 3 wave moves which can be commonly seen in most forex pairs. Paypal is currently moving in 3 wave sequences rather than impulsive waves and the 3 scenarios presented above is only helping us to identify the areas where the cycle can be ending to prepare for the next move. Consequently, the current $50-$55 area can produce a pullback for the stock and depending on the speed and timing of the move we’ll know which cycle has ended and where will be the next buying opportunity as all scenarios are still pointing to more upside after the corrections.
