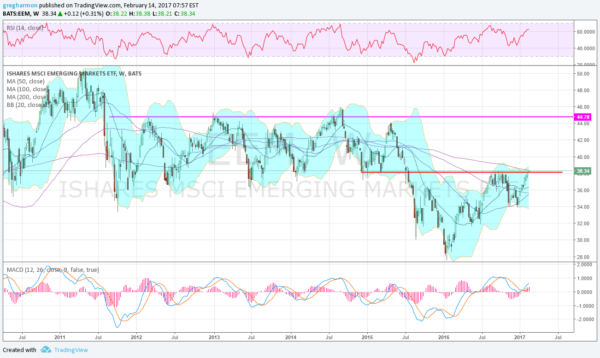
Emerging-market stocks had a strong 2016. There were overshadowed by record setting stock market indexes in the US and political events, but the Emerging Market ETF (NYSE:EEM) rose 35% from its low in January to he consolidation range from August through October. And even after a pullback, it finished the year up over 12%. The pullback found support at its 50-week SMA and formed a double bottom, with price racing higher into 2017.
I have looked at the ETF from a short-term perspective a couple of times in the past month, but today it warrants a look on a longer scale. Monday it closed at an 18-month high, breaking above the resistance area from the summer and fall. It now sits just under its 200-week SMA, which It has not been above since May 2015. Since late 2011, it has spent little time above it. Will that change now?

Several indications suggest there is still major upside potential in Emerging Markets. First is the price action itself. The two steps higher from the January 2016 low suggest that the third step underway should reach to 40. Not a big move but upside from the present value. Momentum supports this as well. The RSI is rising in the bullish zone while the MACD has crossed up and is rising. The Bollinger Bands® are also opening to the upside. Above 40, there is the long-term resistance at about 45, but there is a lot of prior trading history to work through. There may still be a lot of upside left in Emerging Markets, but it looks like it will require patience.
