The Fed is as hawkish as they've been in years...
A hotter than expected inflation reading and more confirmation from the Fed that they will be seeking at least three rate hikes this year set a negative tone for Treasuries. However, the same news was seen by stock trader as a sign of economic growth and prosperity. Accordingly, the seemingly never-ending stock market rally logged another session of buying. What can we say? This is a bull market...and nothing can derail it. In recent weeks we've seen chaos in Washington, riots in the streets of our cities, a North Korean missile headed for our shores, but we've yet to see investors interested in taking profits in the equity markets.
If you ask me, the bulls are starting to get greedy (that said, we've obviously been wrong about the strength of this rally). According to our friends at Consensus, their bullish sentiment index has reached 76%. Generally speaking, this signifies an extreme that often results in a reversal. Likewise, The AAII Index suggests only 25% of those polled were bearish the market. The bus could be getting full...and we all know that that means.
Treasury Futures Markets
The Fed says three hikes, but the market says two (or less)
The market isn't falling for the Fed's lies this year. Last year around this time they were talking big, but only increased rates once by the end of the year. Fed Fund futures traders haven't forgotten this. They are only pricing in a 27% probability of three hikes by the December meeting, and a 32% chance of two rate hikes.
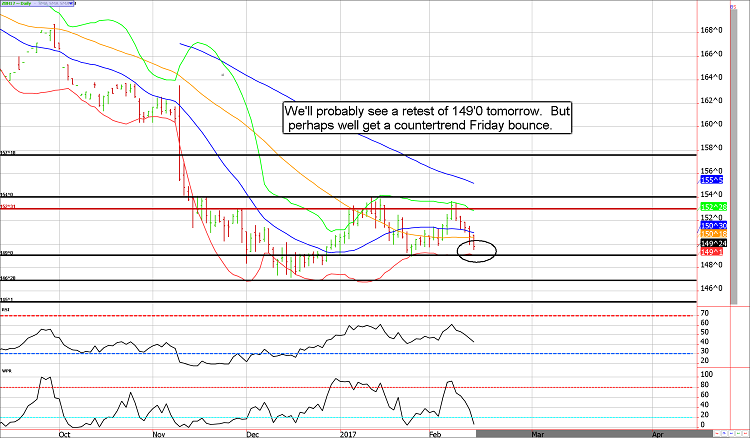
Ironically, as we've been saying...10-year note trades have forgotten. They've also forgotten what has happened each time they have found themselves overly short this market (a rally). That said, the momentum is obviously in favor of the bears so we'll probably see a full retest of the recent lows. However, we expect these levels to hold for now. Particularly, if the stock market rally pauses.
Treasury Futures Market Analysis
**Bond Futures Market Consensus:** We suspect the 149'0 and 123'20ish areas will hold in bonds and notes, respectively. But it is going to be a bumpy ride.
**Technical Support:** ZB : 149'0, 146'28 and 145'01 ZN: 123'20, 123'05 and 122'07
**Technical Resistance:** ZB: 152'31, 154'0, and 157'18 ZN: 124'15, 125'08, and 125'21.5
Stock Index Futures

All the President has to say is "tax cut" and the S&P futures contract rallies.
There isn't much to say about the S&P rally at this point. Animal spirits are getting in the way of logical thinking, but that doesn't always matter in the short-run. And even in the long-run it only "might" matter. I'm not going to say I haven't seen anything like this because I have, and I've seen even "crazier" (yes, this is crazy even if we don't want to admit it because our investment retirement accounts look great).
I saw it in 2011 when gold hit $1,900 and silver reached $50 per ounce. I saw it in 2008 as wheat futures reached $13.00 per bushel, in 2011 when cotton traded over $2.00, and in 2007 when crude oil approached $150. There are other examples but you've probably caught on. This is what markets do, they push prices to the brink before they come crashing down. I'm not saying that we are on the verge of a repeat of 2008 in the stock market; in fact, I remain overall optimistic. However, markets cannot go up forever. Usually, they perform the worst when they look the best.
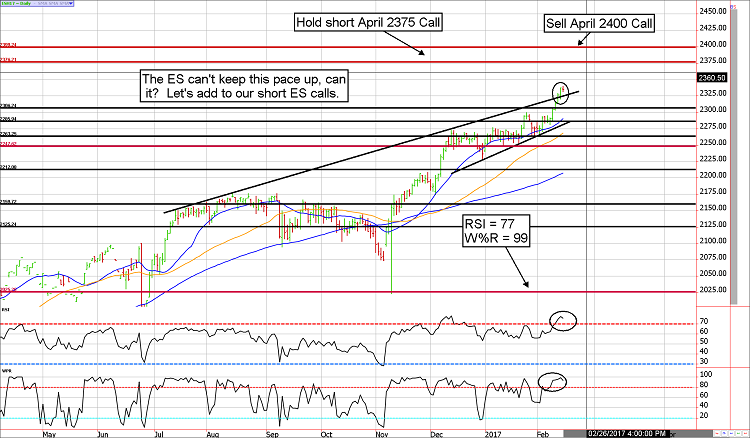
We haven't seen the S&P this overbought since 2013 (based on the weekly RSI).
We added to our short ES calls today, we are currently holding short April ES 2375 and 2400 calls. (*There is unlimited risk in selling options).
Stock Index Futures Market Ideas
**e-mini S&P Futures Market Consensus:**
All of the rules are being broken, there are no limits to the crazy. Yet, "off the chart" oscillators suggest the upside is limited.
***We are now charting the March contract!**
**Technical Support:** 2306, 2285, 2263, 2247
**Technical Resistance:** 2350 and ????
E-mini S&P Futures Day Trading Ideas
**These are counter-trend entry ideas, the more distant the level the more reliable but the less likely to get filled**
ES Day Trade Sell Levels: 2350, and ??? (we have no other tradable level)
ES Day Trade Buy Levels: 2330, 2320, 2309, and 2301
In other commodity futures and options markets....
October 6 - Buy March euro strangles using the 123 calls and the 100 puts for about $400. This trade is looking for a sharp increase in volatility.
November 14 - Sell March euro 100 put for about 41 ticks to lock in $250 to $300 per contract. We are still holding the long call half of the strangle, which is under water.
January 6 - Buy March ES 2025 puts for about 7.50 in premium ($375).
January 18 - Sell April live cattle 127 calls near 97.5 ticks ($390).
January 27 - Buy a June ZN (10-year note) future near 123'16.5 and sell a 123 call for about 1'50. Risk is unlimited under 123, reward is about $1300 at expiration if the futures price is above 123'0.
January 31 - Buy back April live cattle 127 call to lock in quick profit of anywhere from $200 to $250 per contract before transaction costs.
January 31 - Buy back March ES 2345 calls near 4.75 to lock in profit of roughly $200 to $250 per contract before transaction costs.
February 9 - Sell long ES 2025 puts to salvage remaining premium (a little less than 2.00 points).
February 15 - Let's add to our short ES call position by selling the April 2400 call for about 10.00
(Our clients receive short option trading ideas in other markets such as gold, crude oil, corn, soybeans, Euro, Yen, and more. Email us for more information)
Carley Garner
DeCarley Trading (a division of Zaner)
Twitter:@carleygarner
info@decarleytrading.com
1-866-790-TRADE(8723)
www.DeCarleyTrading.com
www.HigherProbabilityCommodityTradingBook.com
DISCLAIMER: There is substantial risk of loss in trading futures and options.** These recommendations are a solicitation for entering into derivatives transactions. All known news and events have already been factored into the price of the underlying derivatives discussed. From time to time persons affiliated with Zaner, or its associated companies, may have positions in recommended and other derivatives. Past performance is not indicative of future results. The information and data in this report were obtained from sources considered reliable. Their accuracy or completeness is not guaranteed. Any decision to purchase or sell as a result of the opinions expressed in this report will be the full responsibility of the person authorizing such transaction. Seasonal tendencies are a composite of some of the more consistent commodity futures seasonals that have occurred over the past 15 or more years. There are usually underlying, fundamental circumstances that occur annually that tend to cause the futures markets to react in a similar directional manner during a certain calendar year. While seasonal trends may potentially impact supply and demand in certain commodities, seasonal aspects of supply and demand have been factored into futures & options market pricing. Even if a seasonal tendency occurs in the future, it may not result in a profitable transaction as fees and the timing of the entry and liquidation may impact on the results. No representation is being made that any account has in the past, or will in the future, achieve profits using these recommendations. No representation is being made that price patterns will recur in the future.
