Below is a combo chart that I’ve shown several times that has the Dow Jones Industrial Average:GOLD ratio on top and gold on the bottom. So far the parabolic move in the ratio and gold is still playing out. As you can see on the gold chart below gold touched the parabolic arc this week with the ratio chart on top doing the same. This was an important week for this ratio and gold to keep the parabolic moves going in each direction.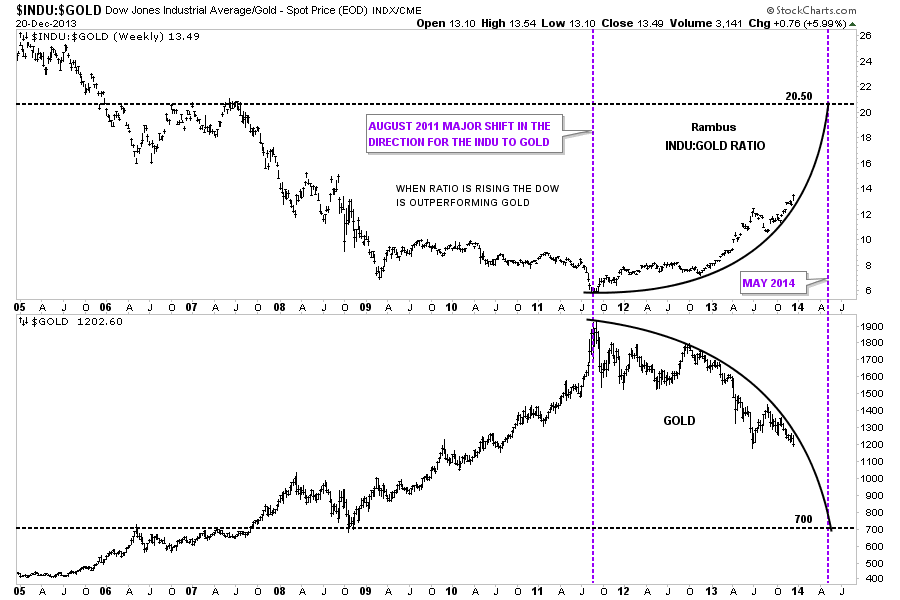
Barrick Gold (ABX) tested its parabolic arc this week and then sold off sharply leaving a nice long tail on the weekly bar.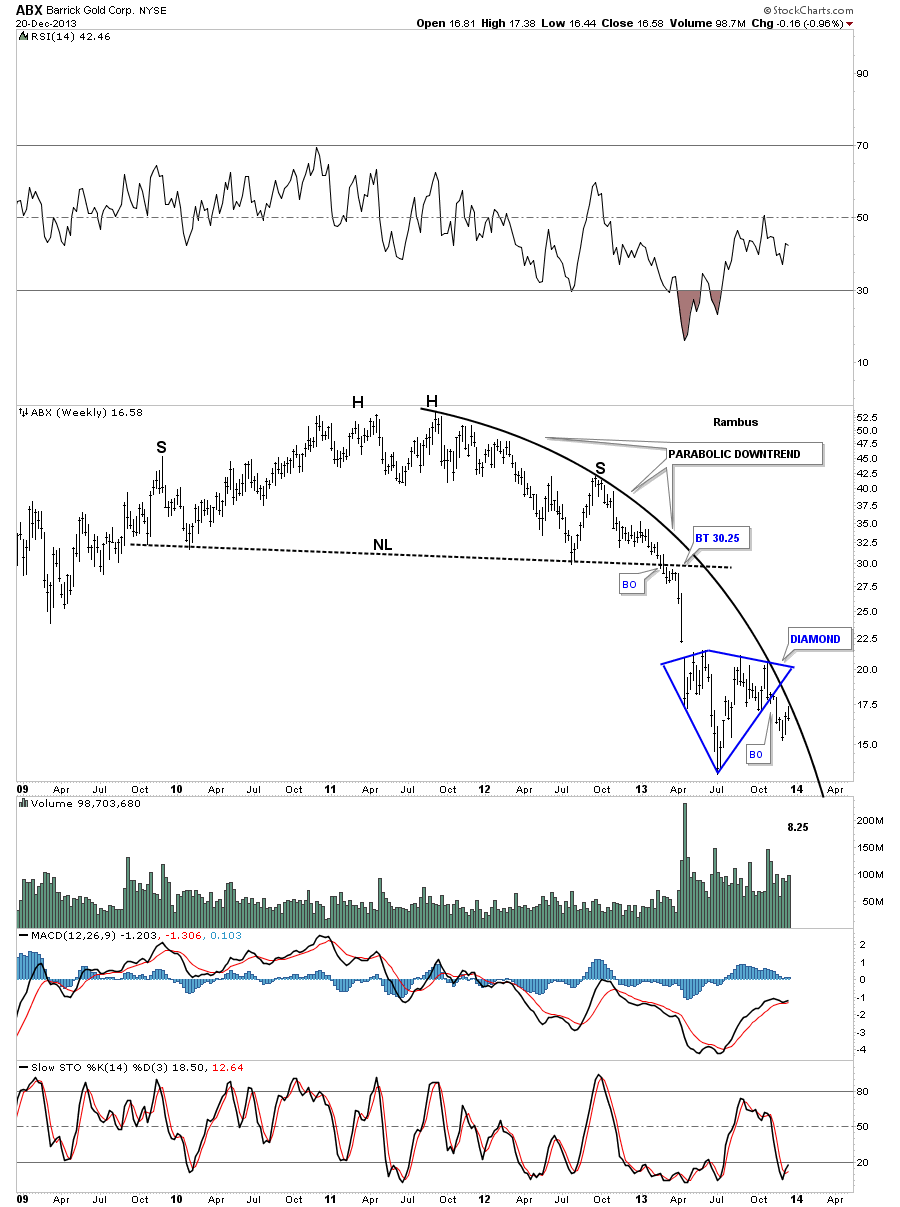
Let's look at a ratio chart that compares gold to the Commodities Index, CCI. As you can see on the chart below, gold has been underperforming a basket of commodities as it’s making a new lower low this month. The massive H&S base measured out almost exactly to the top. Note the red 5 point triangle reversal pattern that called an end to gold outperforming commodities in general.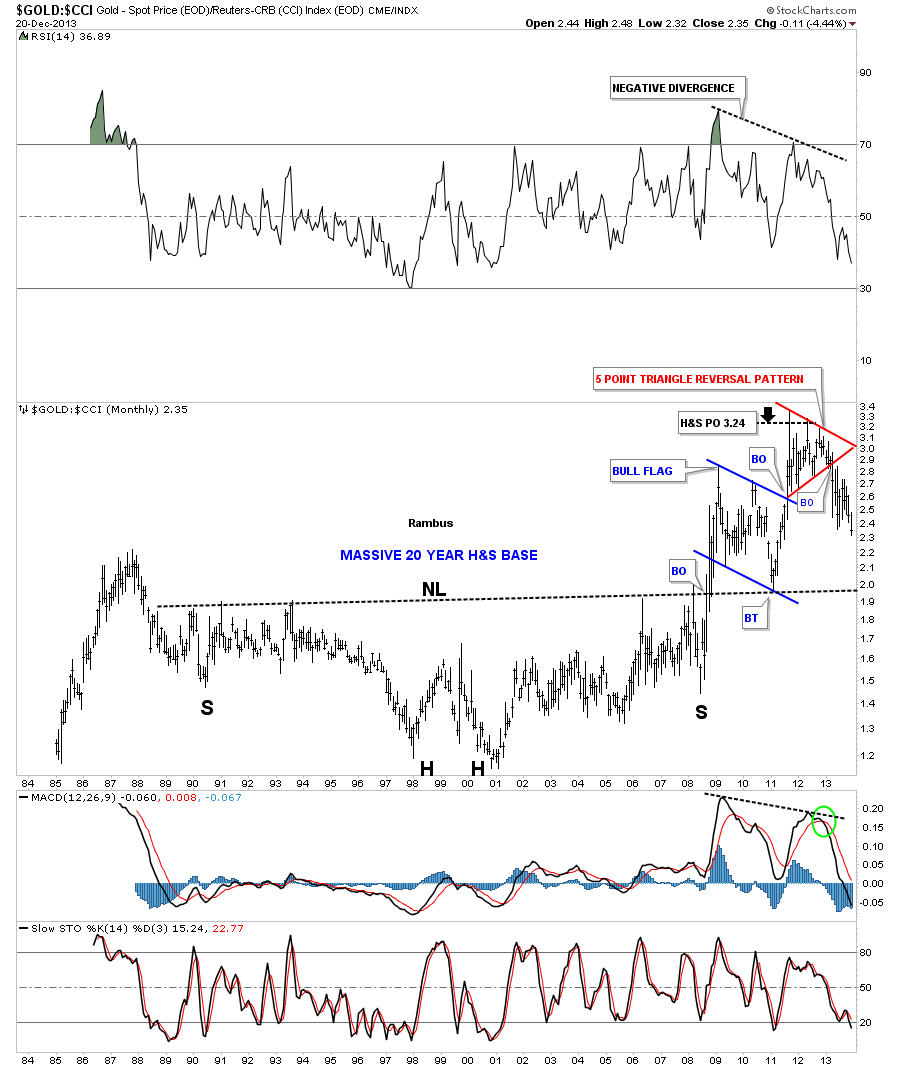
The HUI to gold ratio chart shows the breakout from the red bearish falling wedge still in play as it's been in backtest mode since breaking out. May seems to be showing up as a time objective with some of the charts I’m following. For me, price is more important than time which goes against some of the trading disciplines out there. So if this ratio hits the price objective first, that will take precedence over time.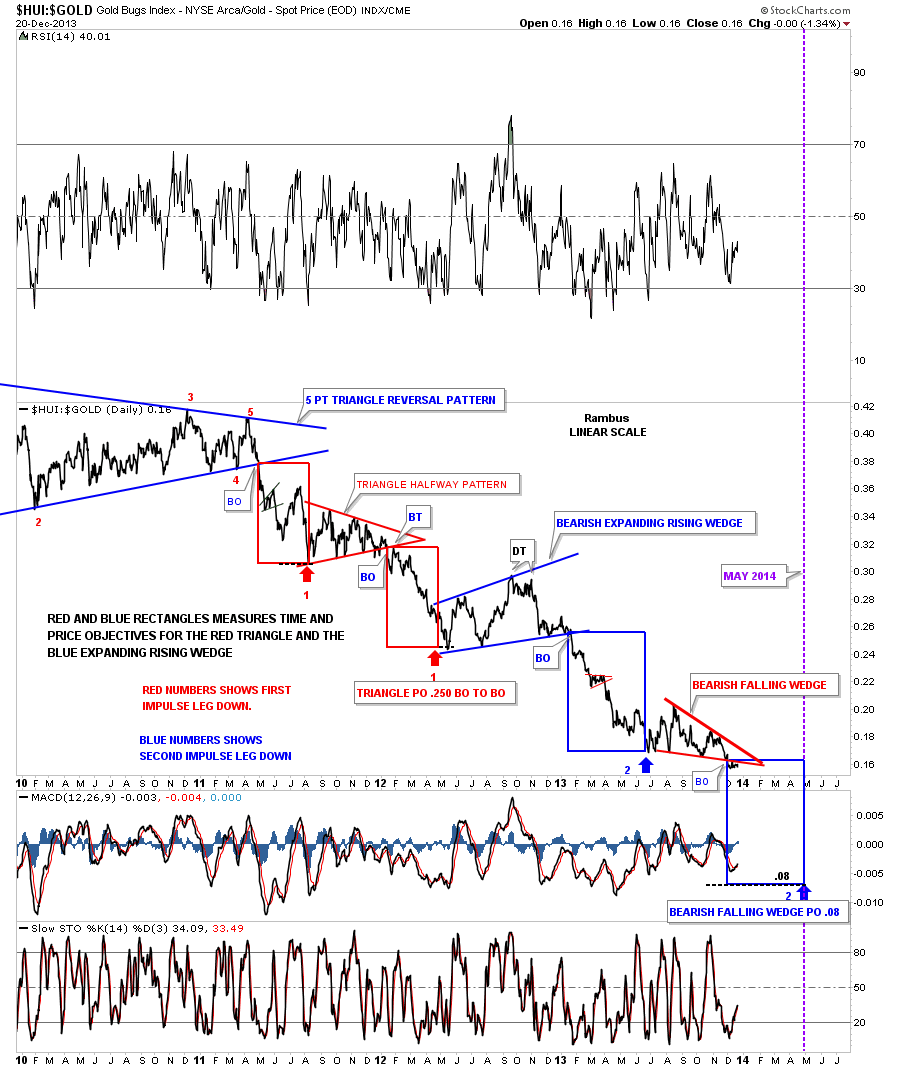
I’ve shown you this gold:XAU chart several times in the past which shows just how badly the big cap precious metals stocks have been underperforming gold. This chart goes back 30 years and never has it been this far out of whack. The problem is that it’s still getting worse as there is a good chance this ratio will make a new all time high by the end of December. It is what it is until it isn’t. Time to hit the hay.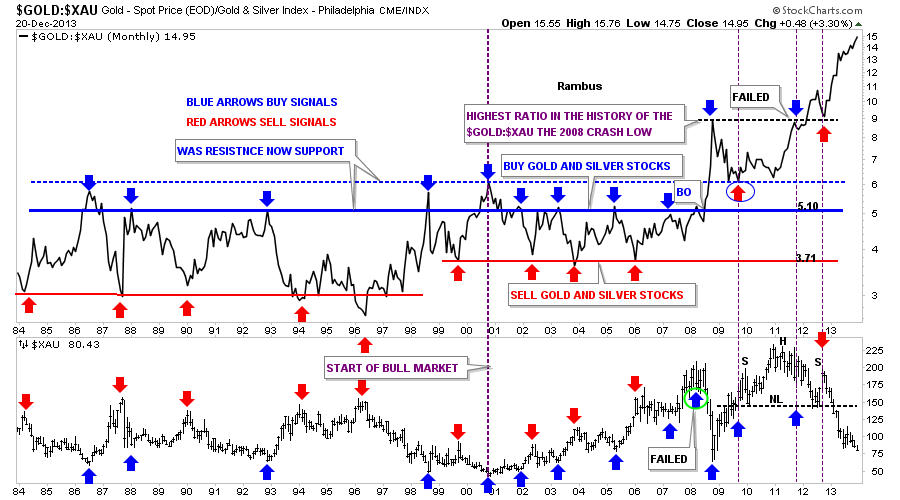
- English (UK)
- English (India)
- English (Canada)
- English (Australia)
- English (South Africa)
- English (Philippines)
- English (Nigeria)
- Deutsch
- Español (España)
- Español (México)
- Français
- Italiano
- Nederlands
- Português (Portugal)
- Polski
- Português (Brasil)
- Русский
- Türkçe
- العربية
- Ελληνικά
- Svenska
- Suomi
- עברית
- 日本語
- 한국어
- 简体中文
- 繁體中文
- Bahasa Indonesia
- Bahasa Melayu
- ไทย
- Tiếng Việt
- हिंदी
Parabolas And Ratios Tell A Story In The PM Complex
Published 12/23/2013, 07:00 AM
Updated 07/09/2023, 06:31 AM
Parabolas And Ratios Tell A Story In The PM Complex
Latest comments
Loading next article…
Install Our App
Risk Disclosure: Trading in financial instruments and/or cryptocurrencies involves high risks including the risk of losing some, or all, of your investment amount, and may not be suitable for all investors. Prices of cryptocurrencies are extremely volatile and may be affected by external factors such as financial, regulatory or political events. Trading on margin increases the financial risks.
Before deciding to trade in financial instrument or cryptocurrencies you should be fully informed of the risks and costs associated with trading the financial markets, carefully consider your investment objectives, level of experience, and risk appetite, and seek professional advice where needed.
Fusion Media would like to remind you that the data contained in this website is not necessarily real-time nor accurate. The data and prices on the website are not necessarily provided by any market or exchange, but may be provided by market makers, and so prices may not be accurate and may differ from the actual price at any given market, meaning prices are indicative and not appropriate for trading purposes. Fusion Media and any provider of the data contained in this website will not accept liability for any loss or damage as a result of your trading, or your reliance on the information contained within this website.
It is prohibited to use, store, reproduce, display, modify, transmit or distribute the data contained in this website without the explicit prior written permission of Fusion Media and/or the data provider. All intellectual property rights are reserved by the providers and/or the exchange providing the data contained in this website.
Fusion Media may be compensated by the advertisers that appear on the website, based on your interaction with the advertisements or advertisers.
© 2007-2024 - Fusion Media Limited. All Rights Reserved.