Pandora Media, Inc. (P) is an Internet radio company in the United States. As of January 31, 2011, it had over 80 million registered users. The Music Genome Project and its playlist generating algorithms enable it to deliver personalized radio to its listeners.
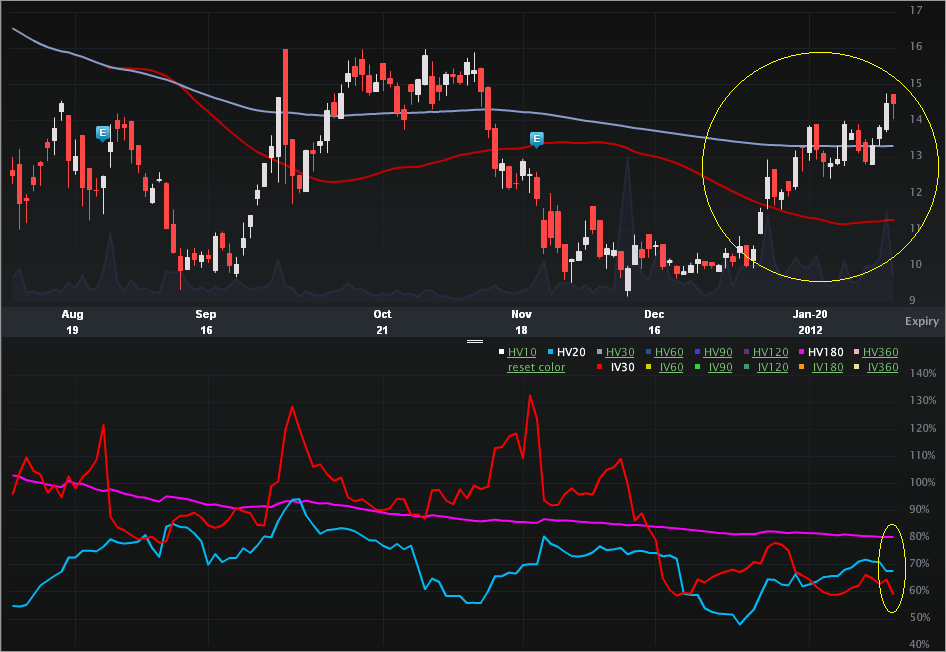
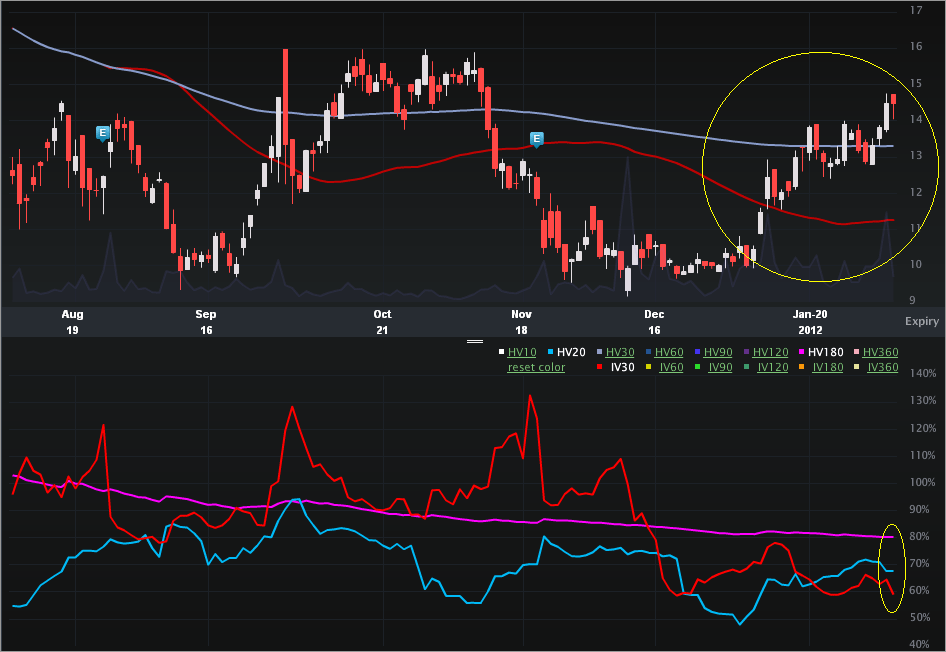
This is a vol note on a stock that has seen a massive upturn of late in stock price and with earnings approaching. Let's start with the Charts Tab (six months), below. The top portion is the stock price, the bottom is the vol (IV30™ - red vs HV20™ - blue vs HV180™ - pink).
In the stock portion we can see the rather abrupt rise from $9.79 (12-21-2011) to now $14.47, or up 47.8% in six weeks. The implied has taken the same train, but in reverse. On 11-21-2011 the IV30™ was 132.16% (the annual high). Yesterday IV30™ has actually breached a new annual low (and now is just barely above) at 59.01%. That's a 55.3% drop in less than three months. The current level is essentially in the 0th percentile (an annual low). It's interesting to note that the next earnings cycle for P is right after Feb expo but in the Mar expiry. Weird given how low vol is...
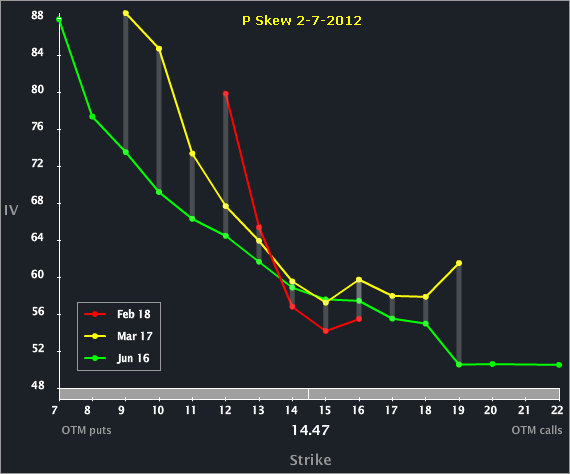
Let's turn to the Skew Tab.
We can see that the Feb expiry shows the lowest vol ATM out of the front three. But, the downside skew in Feb is the most pronounced. That's actually kinda normal, but, given the new annual low in vol and the earnings date approaching in the Mar expo, it wouldn't have been crazy weird if the downside skew in Mar was actually elevated to Feb.
Finally, let's turn to the Options Tab, below.
Feb is priced to 55.44% vol and Mar to 59.43%. Just looking to the ATM straddle in Mar, we can see it's $2.05 x $2.35 while Feb is priced to $1.05 x $1.30.
This is trade analysis, not a recommendation.
- English (UK)
- English (India)
- English (Canada)
- English (Australia)
- English (South Africa)
- English (Philippines)
- English (Nigeria)
- Deutsch
- Español (España)
- Español (México)
- Français
- Italiano
- Nederlands
- Português (Portugal)
- Polski
- Português (Brasil)
- Русский
- Türkçe
- العربية
- Ελληνικά
- Svenska
- Suomi
- עברית
- 日本語
- 한국어
- 简体中文
- 繁體中文
- Bahasa Indonesia
- Bahasa Melayu
- ไทย
- Tiếng Việt
- हिंदी
Pandora Media Volume Hits New Low as Earnings Approach
Published 02/07/2012, 11:48 PM
Updated 07/09/2023, 06:31 AM
Pandora Media Volume Hits New Low as Earnings Approach
Latest comments
Loading next article…
Install Our App
Risk Disclosure: Trading in financial instruments and/or cryptocurrencies involves high risks including the risk of losing some, or all, of your investment amount, and may not be suitable for all investors. Prices of cryptocurrencies are extremely volatile and may be affected by external factors such as financial, regulatory or political events. Trading on margin increases the financial risks.
Before deciding to trade in financial instrument or cryptocurrencies you should be fully informed of the risks and costs associated with trading the financial markets, carefully consider your investment objectives, level of experience, and risk appetite, and seek professional advice where needed.
Fusion Media would like to remind you that the data contained in this website is not necessarily real-time nor accurate. The data and prices on the website are not necessarily provided by any market or exchange, but may be provided by market makers, and so prices may not be accurate and may differ from the actual price at any given market, meaning prices are indicative and not appropriate for trading purposes. Fusion Media and any provider of the data contained in this website will not accept liability for any loss or damage as a result of your trading, or your reliance on the information contained within this website.
It is prohibited to use, store, reproduce, display, modify, transmit or distribute the data contained in this website without the explicit prior written permission of Fusion Media and/or the data provider. All intellectual property rights are reserved by the providers and/or the exchange providing the data contained in this website.
Fusion Media may be compensated by the advertisers that appear on the website, based on your interaction with the advertisements or advertisers.
© 2007-2025 - Fusion Media Limited. All Rights Reserved.
