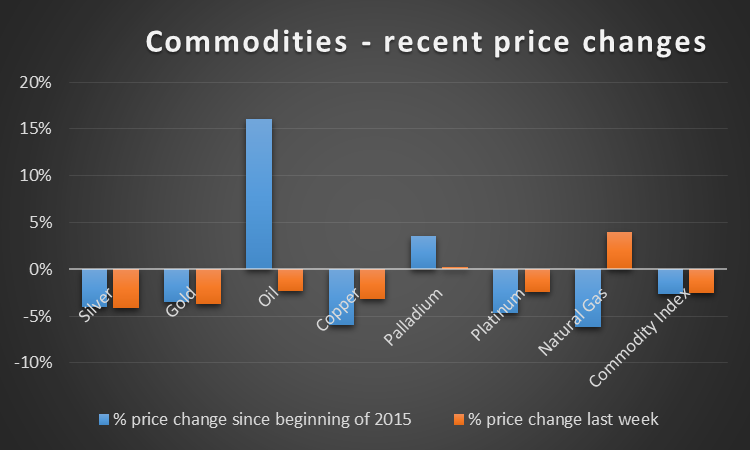
Palladium has been one of the stronger performing commodities this year, as shown in the graph below. The commodity price has been on an uptrend since 4Q 2011.

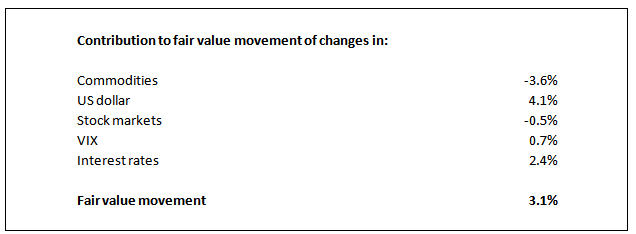
Last week saw a marginal firming (price up 0.2% to $815), a move below the increase in fair value of 3.1%. The fair value is assessed using a multiple regression analysis of the palladium price on 22 driver variables including interest rates, stock indices, other commodities and exchange rates. The database is six years of daily prices.
The contribution of each driver variable to the decrease in palladium’s fair value last week is shown in the graph below:

A significant factor was the strength in the US dollar index (up 2.5% over the week), to which palladium’s fair value is positively correlated. The firming of long term interest rates also supported the fair value.
An excess of fair value increase over price increase would normally be a signal to go long palladium.Taking positions based on disparities between price and fair value change would have yielded an annualized gain of 51% with volatility of 20% over the last 90 days
Our assessment of palladium’s fair value using the multiple regression model lies 3% above the current price, suggesting that the commodity is undervalued on fundamentals. However taking positions in palladium based on this signal of under/over valuation would have generated marginally negative returns over the last 90 days – hence we are inclined to use caution when relying on this indicator.
We have also developed a signal based on the lead given by the change in the Baltic Dry Index (BDI) of raw material shipping freight rates. This index is widely seen as a leading indicator of world economic growth, with increases viewed as bullish and conversely. Based on the relationship between the BDI and palladium price over the last six years and the 1% increase in the BDI over the last month, a short term increase in the palladium price can be seen as likely.
Trading this signal would have yielded a 19% per annum gain with volatility of 31% over the last six years.
Relationship to USD and volatility
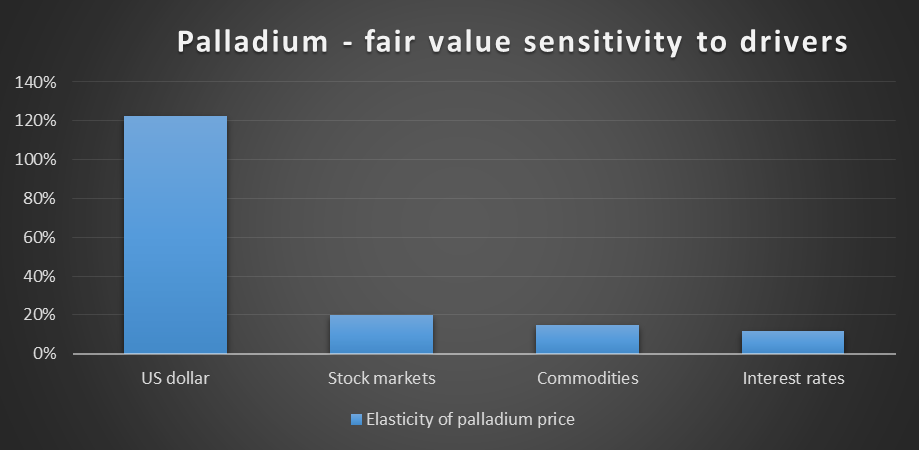
The graph below shows the sensitivity of palladium’ fair value to the drivers on which the fair value is based –

As can be seen, palladium is positively correlated to the US dollar. Our fair value indicators suggest some short term upside in the US dollar index which would augur well for palladium.
The USD may undergo some volatility this week if the retail sales print (Thursday) comes in some distance from consensus. EURUSD may also move depending on the outcomes from the Euro group meeting on Monday. Given the high sensitivity of palladium to the USD evident in the above graph, this could translate into volatility in the palladium price.
This week has historically been of average volatility for palladium—looking back over the last three years at palladium’ price changes for the week after the nonfarm payrolls print, we find a volatility of 22% vs volatility for all weeks over the period of 22%.
