In our previous article, we talked about the Bullish Palladium XPD/USD which is supporting the commodity market for another leg to the upside. To be able to join for the move higher, we need to identify the potential scenarios and look for the next inflection areas using our Elliott Wave Theory charts.
XPD/USD Elliott Wave View
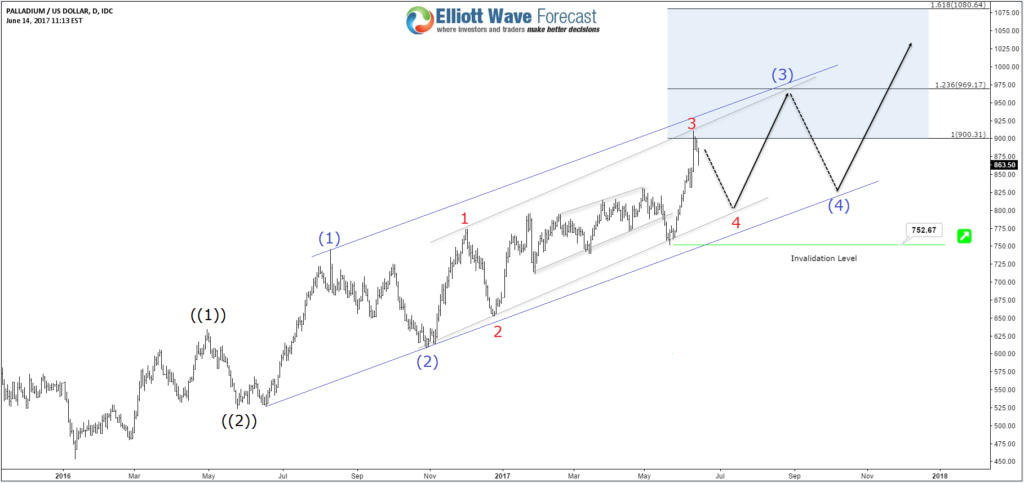
The move from January 2016 low is advancing in a series of 5 waves forming higher highs & higher lows and has a high probability of completing an impulse move as it keeps extending higher. So technically the metal should trade within the bullish channel and see higher levels around $970 – $1080.

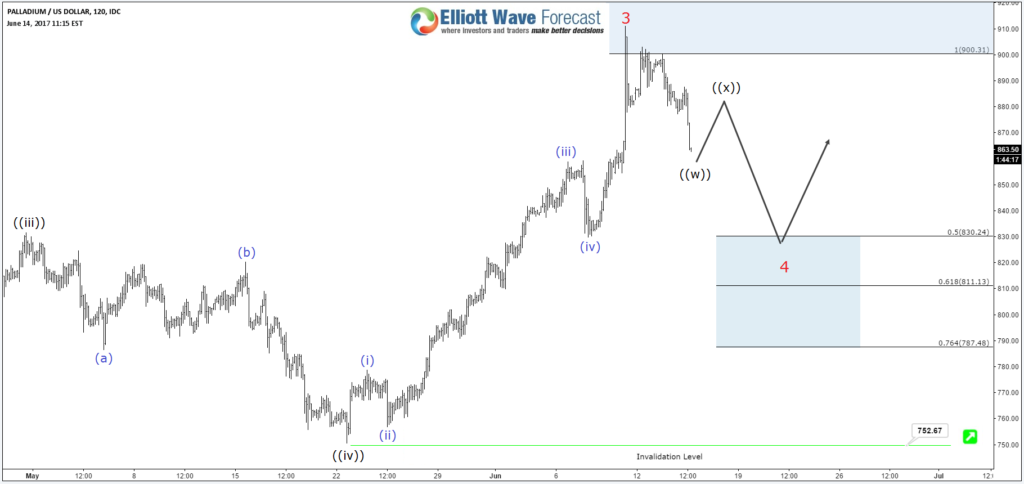
On Friday June 9, XPD/USD reached equal legs area $900 from January 2016 low and already reacted lower from there ending the cycle from 05/22 low. The metal did 3 waves from the peak which could be enough to resume higher , but if we correlate the move with the rest of commodities then while it’s holding below the peak it can still make another leg lower toward the 50% – 76.4% area $830 – $787 before another bounce higher is seen as long as pivot at 752 low keeps holding.

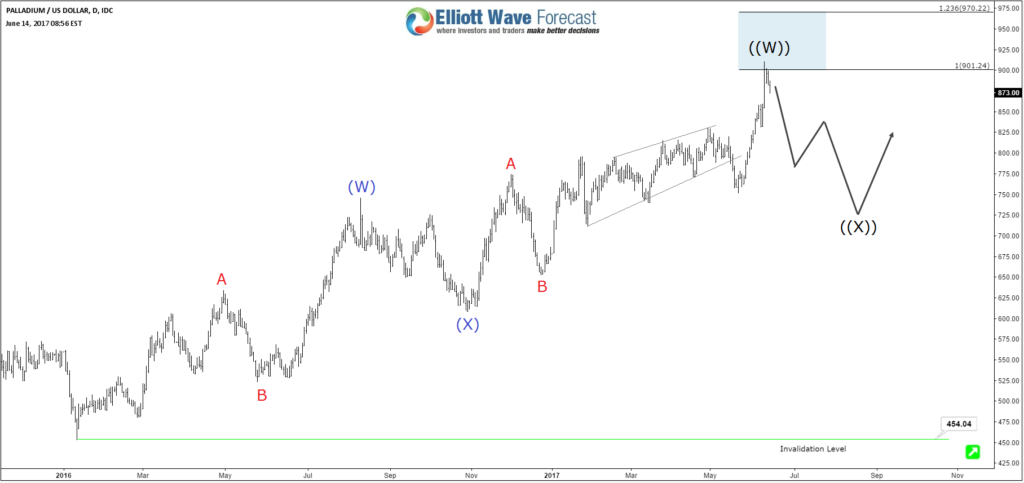
If XPD/USD mange to break below $752, then most likely it will end the cycle from January 2016 low as a double three structure and will do a deeper correction that can reach the 50% retracement around $680 before it resumes the move to the upside.

Recap
Palladium is currently the strongest performing metal and having a monthly bullish sequence is clearly sending a warning message for commodity bears So it’s not a wise choice to look for the short side at current stage and it’s better to trade the clearest structure among the the strongest instruments.
