Palladium Gets Interesting As It Approaches New High

Published 06/21/2019, 06:25 AM
Updated 07/09/2023, 06:31 AM
PA
-
XPD/USD
-

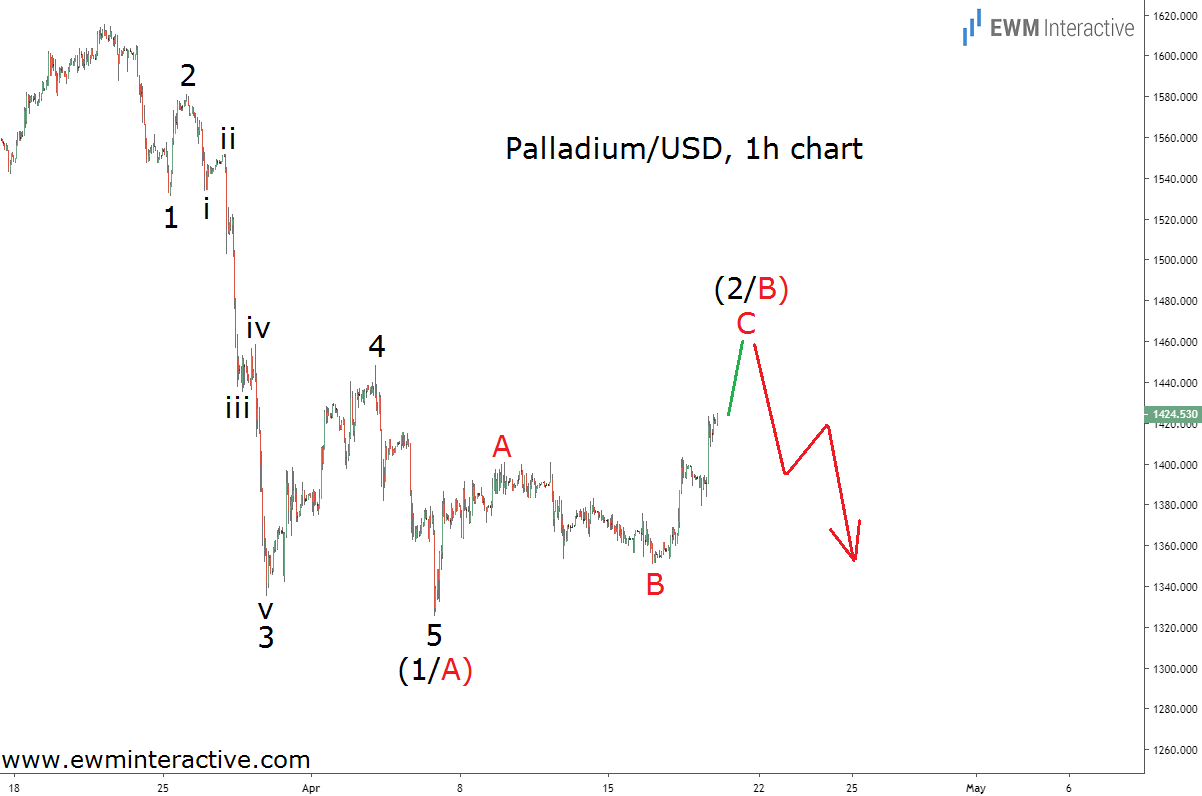
Two months ago, the price of palladium was hovering around $1425 following a recovery from as low as $1325. Unfortunately for the bulls, the structure of the decline from $1615 to $1325 suggested still lower targets were plausible. The chart below, published on April 21st, visualizes the reason for our pessimism.
Palladium/USD 1 Hour Chart

The hourly chart of palladium revealed a five-wave impulse to the south from $1615 to $1325. According to the Elliott wave theory, once the corresponding three-wave recovery in wave (2/B) was over, another selloff in wave (3/C) was supposed to follow.

Instead of joining the bulls near $1425 two months ago, we thought it was time for caution. How far the anticipated decline was going to go was unknown, but initial targets below the bottom of wave (1/A) made sense. Then this happened:
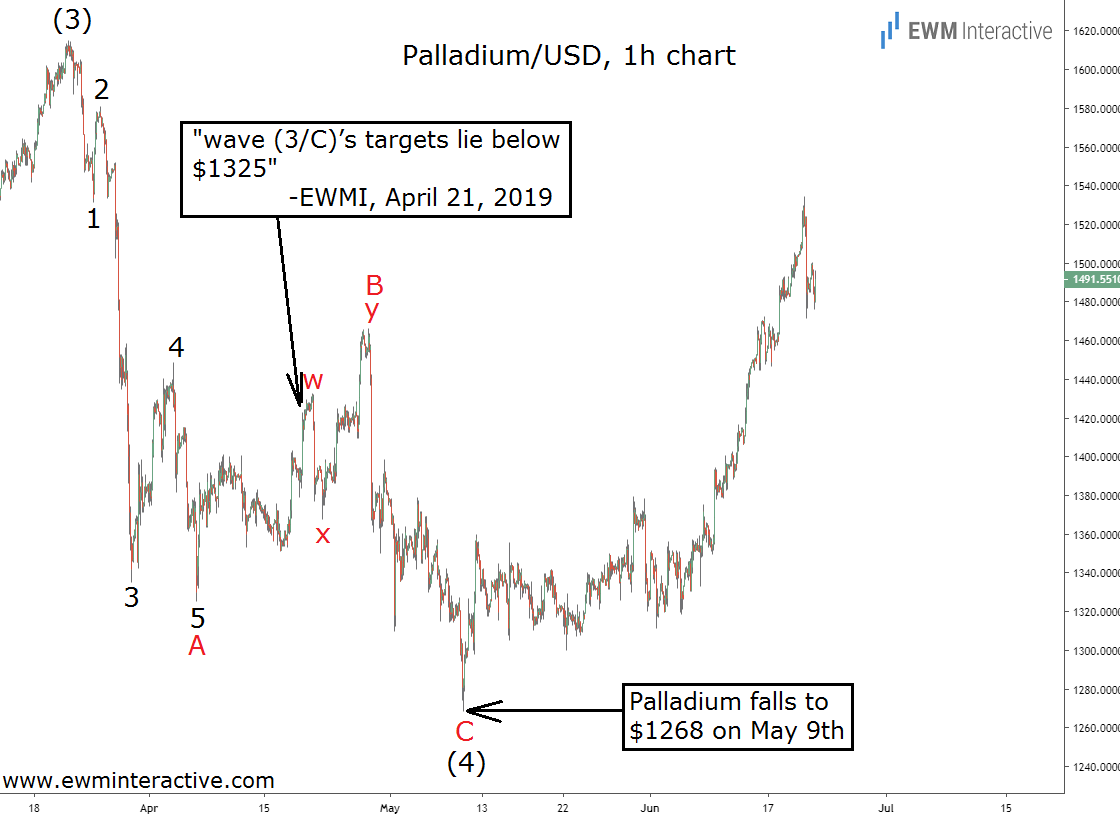
Palladium Fulfills Bearish Elliott Wave Forecast

On May 9th, the price of palladium fell to $1268, down 11% in less than 20 days. The following rebound to $1535 so far means the pullback between $1614 and $1268 is a simple A-B-C zigzag. In order to see where it fits in the bigger picture, we have to take a look at the daily chart below.
XPDUSD Daily Chart Elliott Wave Outlook

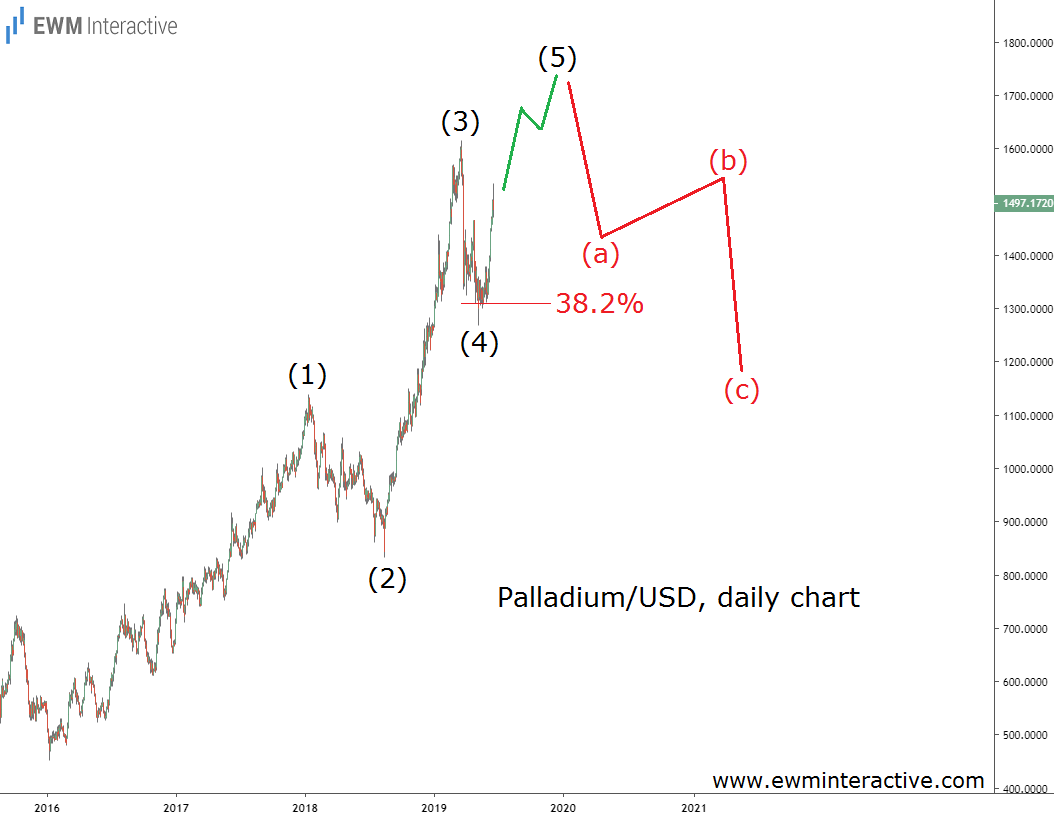
The daily chart shows that the entire rally from $453 in January 2016 is a five-wave impulse in progress. Wave (1) up to $1139 was followed by a pullback in wave (2) down to $833. Wave (3) traveled all the way up to $1615, before the bulls returned in wave (4) to $1268.

Palladium Poised for a Bearish Reversal

The fact that wave (4) found support near the 38.2% Fibonacci level, further reinforces our belief that the current surge is part of wave (5) up. Wave (5) is supposed to exceed the top of wave (3). If this count is correct, we can expect a new high very soon. Once there, things will get very interesting.

A 260%+ rally in less than four years can convince palladium investors the uptrend is going to go on indefinitely. Alas, no trend lasts forever and palladium’s is unlikely to be the first to do so. A three-wave correction in the opposite direction follows every impulse. In XPD/USD ‘s case, once wave (5) completes the pattern, a notable decline back down to ~$1200 can be expected.

Original Post

Latest comments

Loading next article…
Risk Disclosure: Trading in financial instruments and/or cryptocurrencies involves high risks including the risk of losing some, or all, of your investment amount, and may not be suitable for all investors. Prices of cryptocurrencies are extremely volatile and may be affected by external factors such as financial, regulatory or political events. Trading on margin increases the financial risks.
Before deciding to trade in financial instrument or cryptocurrencies you should be fully informed of the risks and costs associated with trading the financial markets, carefully consider your investment objectives, level of experience, and risk appetite, and seek professional advice where needed.
Fusion Media would like to remind you that the data contained in this website is not necessarily real-time nor accurate. The data and prices on the website are not necessarily provided by any market or exchange, but may be provided by market makers, and so prices may not be accurate and may differ from the actual price at any given market, meaning prices are indicative and not appropriate for trading purposes. Fusion Media and any provider of the data contained in this website will not accept liability for any loss or damage as a result of your trading, or your reliance on the information contained within this website.
It is prohibited to use, store, reproduce, display, modify, transmit or distribute the data contained in this website without the explicit prior written permission of Fusion Media and/or the data provider. All intellectual property rights are reserved by the providers and/or the exchange providing the data contained in this website.
Fusion Media may be compensated by the advertisers that appear on the website, based on your interaction with the advertisements or advertisers.
© 2007-2025 - Fusion Media Limited. All Rights Reserved.