There are many risks with blindly following models, but one of the more pernicious hazards is overlooking the problems that arise from assuming that in-sample results will hold up with out-of-sample data. The pitfalls are well known, or at least they should be. In any case, the challenge boils down to an all-too-common problem: What looks good on paper doesn’t easily translate into real-world results. Why? Any number of answers apply. For now, let’s focus on one: the data set in a given study doesn’t age well. This stumbling block arises anew this week in an article from MarketWatch that points us to an eight-year-old study that finds a reasonably strong connection between the monthly return on oil prices and the next-month’s return on the stock market.
The MarketWatch story from a few days ago announces that “stock investors should be cheering a bear market in oil.” The writer explains that a 2008 paper in the Journal of Financial Economics—“Striking Oil: Another puzzle?”—finds that the monthly changes in crude do a reasonably good job of predicting the subsequent monthly return for stocks. “The big takeaway: An oil-price decline in one month ‘indicates a higher stock market return [the] next month,’ the report says,” according to the story.
Many studies have found a link between oil and the economy, of course, and so the basic intuition that a critical input for macro activity will cast a long shadow is well-founded. But there are limits, especially when you’re digging around for short-term forecasts. Case in point: When you study how monthly returns between oil and stocks behave over recent decades, the enthusiasm that the MarketWatch story generates for the cited research isn’t reflected in the numbers–the recent numbers, to be precise. That’s not because the study was wrong. Rather, it seems that the last several years have reshuffled a thing or two in the capital and commodity markets. Digging a bit deeper, it turns out that there’s a bit of a disconnect between the time period studied in the research (through 2003) and the historical record since then.
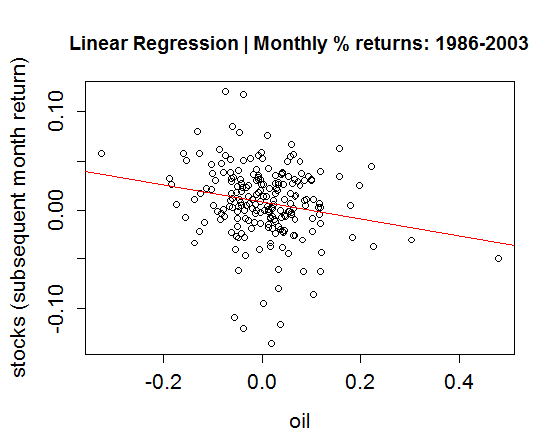
As a quick test, let’s run a simple linear regression on the data in R (see the code below to replicate the charts that follow). Tapping into the St. Louis Fed’s FRED database, we’ll analyze average monthly percentage changes for crude oil (West Texas Intermediate) and US stocks (Wilshire 5000). As the first chart shows, there is in fact a mildly negative correlation between monthly returns on oil prices and the following month’s performance for US stocks–just as the research documented. The best-fit line shown in red summarizes the relationship:

Clearly, negative returns for oil tend to be associated with positive results for stocks in the month that follows. It’s debatable whether this connection is sufficiently robust for a profitable trading strategy, but the initial results look encouraging if only as an incentive for further study.
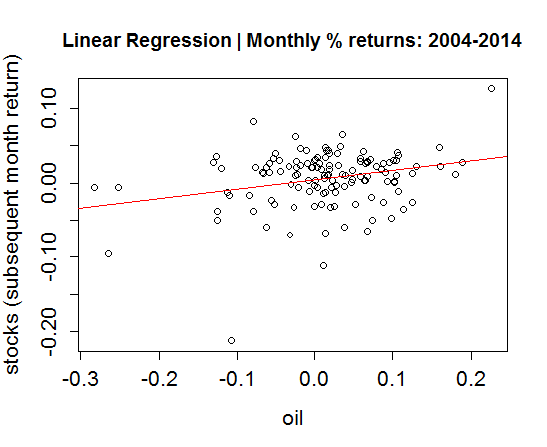
But a funny thing happened on the road to easy profits: the relationship in the data suffered a degree of reversal since 2004. Indeed, running the regression on the numbers from 2004 through last month dispenses a slightly different profile:

This is hardly the first time that a predictor that impresses with in-sample data delivers something else later on. Nonetheless, this reversal (albeit one based on limited data) is a reminder that forecasting returns by way of historical relationships is usually tougher than it appears in the rear-view mirror. All the more so if the objects in that rear-view mirror are at a considerable distance from our current location.
Granted, it would be short-sighted to dismiss the idea that oil prices are a productive source of information for investors. And just to be fair, my analysis above is hardly a definitive test. There are quite a few additional steps to take if we were seriously considering the oil-stock paradigm for investing. Rather, the point here is simply that spinning gold from academic studies is a rougher road than some would have you believe.
But let’s not throw the baby out with the bathwater. Sure, expecting short-term shifts in the oil market to deliver reliable signals for the next month’s equity returns may be asking too much. Yet perhaps we simply need to study the relationship in more detail and from multiple perspectives. Any number of possibilities come to mind. Maybe one-year returns are more reliable; or a multi-factor model that combines oil, interest rates and a macro number that arrives with relatively timely updates… weekly jobless claims, for instance.
Yes, the sky’s the limit for considering the possibilities. Most are a dead end. There are exceptions, of course, or so it seems. Momentum is at the top of the list. As return anomalies go, this one’s second to none for persistence. It’s still mostly a mystery in terms of why it hasn’t been arbitraged away. In any case, it’s fair to say that predictors that shine as brightly and as consistently as momentum are a rare breed, although that doesn’t stop the crowd from suggesting otherwise.
