Dr. Lacy Hunt has been featured more than any outside speaker at our IES conferences. Why? Because he’s the only classical economist I fully admire and he is a successful bond investment manager in the real world that understands the trend towards deflation, despite unprecedented money-printing.
I love the gold bugs for being realistic and honest about the debt and financial asset bubble we’re in, especially when most mainstream economists and analysts are blind to it.
What kills me about the gold bug types is that they always see hyperinflation from unprecedented money-printing, and they don’t go back and analyze what actually happens when debt bubbles finally burst and deleverage…
DEFLATION!
There is no other cure for excessive use of financial drugs, and that is what excessive use of debt is – plain and simple. Debt is a financially-enhanced drug that has major costs down the road.
It’s like detox for heroin addicts.
It is ugly, but it purges the system of the drug and allows it to be healthy and grow again. There is no easy way around that once you are highly addicted and toxic from it. And we are witnessing the greatest debt and financial asset bubble since the early 1970s, more so than 2000!
Lacy is a classical, Austrian economist that totally gets how debt and financial bubbles build and how they deleverage and burst. Only Steve Keen in Australia (now London) garners a similar respect from me for such research.
Lacy has the “voice of God,” as Rodney calls it, and always has interesting charts and research. His bond fund at Hoisington Investment Management has continued to be a long-term winner betting on deflation, not inflation, showing he puts his money where his mouth is.
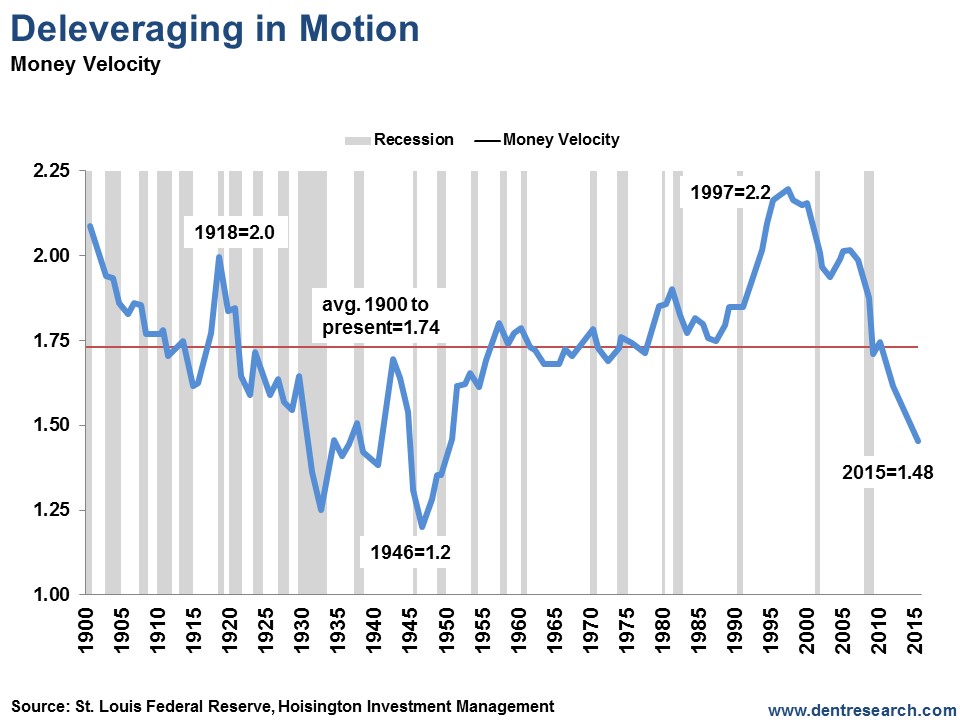
But my favorite of all of his charts – and the most unique – is his chart on money velocity, going back to 1900.

This chart clearly shows a major cycle in rising and falling money velocity. And money velocity has everything to do with the expansion of our money supply from leveraged bank lending against 10% deposit and capital reserves.
Money is created like magic. But it also disappears just as fast when things go south… now you see it, now you don’t!
It is Lacy’s explanation of this chart that sets him apart from other clueless economists, and even the best gold bugs.
Note the average trend line across the chart, at a money velocity of about 1.74 times. That is normal. When money velocity is rising faster than that, it is a sign that businesses (and consumers and governments) are making productive investments in new capacity that raise profits, wages and so on.
It’s a win-win for the economy and mostly everyone.
When money velocity starts falling however, as it did after 1918 and after 1997, it is a sign that investment is going into more speculative pursuits that don’t create productive capacity and returns – like stock buybacks and mergers & acquisitions for businesses, or like flipping tech stocks or condos for households.
That shows you are entering a bubble economy, like the Roaring 20s or the Roaring 2000s (as I termed it in my 1998 book title).
But when you start falling below that long-term average of money velocity you are entering a deflationary or deleveraging stage, which we did from 2008 forward… but such deleveraging and deflation has been simply covered over by endless QE and money-printing.
Despite such “something for nothing” stimulus, money velocity continues to decline. That’s why we aren’t getting inflation, nevertheless hyperinflation, and why we won’t in the future!
Deflation is the only trend for the next several years and no one understands that better than Lacy Hunt. I may have a little debate with him on the rising odds of a near-term spike in Treasury yields before we head towards even lower rates again.
