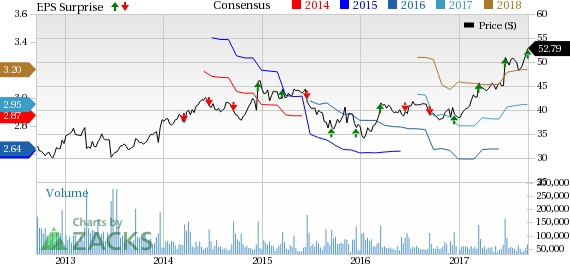
Oracle Corporation (NYSE:ORCL) delivered strong first-quarter fiscal 2018 results. Non-GAAP earnings of 62 cents per share and revenues of $9.21 billion comfortably beat the Zacks Consensus Estimate of 61 cents and $9.03 billion, respectively.
Earnings increased 12.3% from the year-ago quarter and were better than the company’s guided range of 59-61 cents. This was primarily driven by 7% (6% in constant currency) growth in revenues that was in line with the high end of management’s guidance of 4-6%.
Oracle’s top-line growth benefited from the ongoing cloud-based momentum. Total cloud revenues (16.2% of total revenue versus 11.4% in the year-ago quarter) advanced 51.3% (60% in constant currency) to $1.49 billion.
Moreover, total cloud and on-premise software revenue increased 8% in constant currency to $7.41 billion. Management noted that 80% of Oracle’s trailing 12-month software and cloud revenue is now recurring.
We believe that the company’s growing cloud market share will continue to drive top-line growth in the foreseeable future. The expanding customer base that includes the likes of AT&T Inc. (NYSE:T) , Liberty Mutual Insurance, Advance Auto Parts Inc. (NYSE:AAP) and others is a key catalyst.
Shares Decline on Soft Outlook
Shares were down 4.5% in after-hour trading following the results. The decline apparently reflects soft outlook. Earnings are anticipated to be between 64 cents and 68 cents for the quarter, with a positive impact of couple of cents from favorable currency tailwind.
The high-end of the guidance is lower than the Zacks Consensus Estimate for earnings, which was pegged at 69 cents.
Moreover, cloud growth outlook was unimpressive. Cloud revenues including SaaS, PaaS and IaaS are expected to grow between 39% and 43% (41% and 45% in the U.S. dollars), much lower than 51.3% reported by Oracle in the last quarter and 64.1% in the fourth quarter of fiscal 2017.
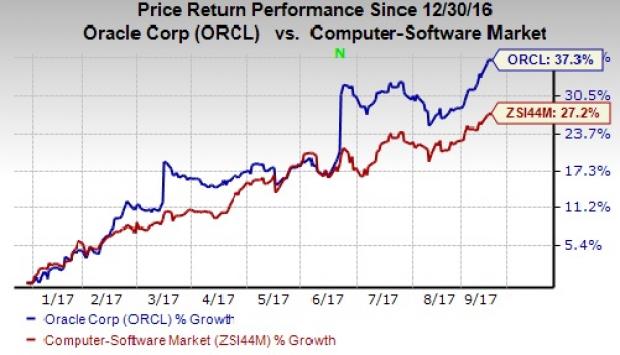
Oracle’s stock has gained 37.3% year to date, substantially outperforming the 27.2% rally of the industry it belongs to. However, a brake in the cloud momentum can drag down the stock price in fiscal 2018.
Cloud Drove Solid Top Line
Cloud software as a service (SaaS) revenues advanced a significant 61.6% (62% in constant currency) year over year to $1.09 billion. Cloud Platform as a Service (PaaS) and Infrastructure as a Service (IaaS) revenues surged 29.2% (28% in constant currency) to $403 million. Cloud deferred revenues surged 53%.
On-premise software revenues (64.2% of total revenue versus 67.6% in the year-ago quarter) increased 1.6% (1% at constant currency) to $5.92 billion reflecting continued higher attachment rates of software support and renewal rates.

ERP surged 90% organically. Management stated that Fusion HCM soared 109%, which was double the growth rate of Workday (NYSE:WDAY) . Database as a Service was up 53% from the year-ago quarter. CX also increased double digits organically.
On Oct 1, Oracle is set to launch the next-generation database, which will be a totally autonomous system supported by machine learning. The company will be offering public Cloud service level agreements (SLAs) for the Oracle database that guarantee 99.995% systems availability time. This practically signifies less than 30 minutes of planned or unplanned downtime per year.
Management believes that the new database will improve Oracle’s competitive position in the cloud against Amazon (NASDAQ:AMZN) Web Services (AWS).
Per Oracle, PaaS infrastructure, business analytics and data integration revenues were up 28%, 130% and 221%, respectively.
Software updates and product support revenues were almost $4.95 billion, up 2% in constant currency. On a combined basis, on-premise support and SaaS revenues were up 17%.
Total hardware revenue slipped 5.3% (down 6% at constant currency) year over year to $943 million. Services revenues increased 6.4% (up 5% at constant currency) to $860 million.
Operating Details
SaaS gross margin was 67%, significantly higher than 59% reported in the year-ago quarter. PaaS and IaaS gross margin was 43% down from 58% posted in the year-ago quarter due to continued investments on geographical expansions.
Operating expenses, as percentage of revenues, decreased 160 bps to 58.9%. The decline can primarily be attributed to lower software license updates and product support, hardware, services, sales & marketing and research & development expenses, which were down 40 bps, 50 bps, 40 bps, 80 bps and 60 bps, respectively.
As a result, non-GAAP operating margin expanded 160 bps from the year-ago quarter to 41.1%.
Balance Sheet & Cash Flow
As of Aug 31, 2017, Oracle had cash & cash equivalents and marketable securities of $66.89 billion, up $819 million sequentially. Trailing four-quarter operating cash flow was $14.8 billion, while free cash flow was $12.6 billion.
Share Repurchase & Dividend Continues
Oracle bought back 10.2 million shares for a total of $500 million in the quarter. In the last 12 months, the company repurchased 46.6 million shares for a total of 2 billion and paid out dividends of $2.8 billion.
Guidance
For second-quarter fiscal 2018, total revenue is anticipated to grow in the range of 2%-4% in constant currency (4%-6% in the U.S. dollars). Favorable exchange rate will help revenues by at least 3%.
Oracle expects SaaS gross margin to improve in fiscal 2018 and hit 80% sometime during fiscal 2019. As the company gains scale, management expects PaaS and IaaS gross margins to expand significantly.
Currently, Oracle carries a Zacks Rank #3 (Hold). You can see the complete list of today’s Zacks #1 Rank (Strong Buy) stocks here.
Looking for Stocks with Skyrocketing Upside?
Zacks has just released a Special Report on the booming investment opportunities of legal marijuana.
Ignited by new referendums and legislation, this industry is expected to blast from an already robust $6.7 billion to $20.2 billion in 2021. Early investors stand to make a killing, but you have to be ready to act and know just where to look.
See the pot trades we're targeting>>
Workday, Inc. (WDAY): Get Free Report
AT&T Inc. (T): Free Stock Analysis Report
Advance Auto Parts Inc (AAP): Free Stock Analysis Report
Oracle Corporation (ORCL): Free Stock Analysis Report
Original post
Zacks Investment Research

