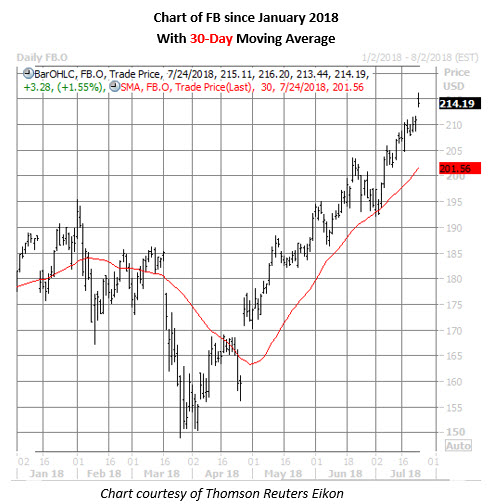
FB's 2 Most Recent Earnings Reactions Were Positive
The shares of Facebook (NASDAQ:FB) are trading up 1.6% at $214.33 – fresh off a record high of $216.20 – on a halo lift from fellow FAANG stock Alphabet (NASDAQ:GOOGL), which is rallying post-earnings. Facebook will take its own turn in the earnings confessional after the close Wednesday, July 25, and the options market is pricing in a bigger-than-usual earnings reaction for the social media name.
At last check, the implied daily earnings move for FB stock was 8.1% – per data from Trade-Alert – much larger than the 3.3% next-day move the shares have averaged over the last eight quarters. It's been a toss of the coin as to whether these post-earnings moves have been positive or negative, though the two most recent returns have been to the upside.
It looks like one FB options trader last week bet on a big move for the stock, regardless of direction. Specifically, the August 200 call and put are Facebook's top two open interest positions, due in part to a long straddle that was likely initiated last Monday, July 16, for an initial net debit of $16.35 per spread ($12.05 for the call + $4.30 for the put).
If this is the case, the premium buyer can profit if FB stock breaks out above the upper breakeven rail of $216.35 (strike plus net debit) or plummets below the lower breakeven rail of $183.65 (strike less net debit). The most the trader stands to lose is the initial cash outlay, should the shares settle at or near the strike at the close on Friday, Aug. 17, when front-month options expire.
Calls are the options of choice in today's trading, and are outpacing puts by a 2-to-1 margin. Most active is the August 230 call, though it's not easy to tell if traders are buying or selling the out-of-the-money strike. More clear-cut activity is occurring at the weekly 7/27 185-strike call, where all signs suggest new positions are being purchased for a volume-weighted average price of $30.59 – making breakeven at Friday's close $215.59 (strike plus premium paid).
Meanwhile, the stock's 30-day at-the-money implied volatility (IV) of 31.3% ranks in the 81st annual percentile, indicating short-term options are pricing in higher-than-usual volatility expectations -- not unusual in the lead up to earnings. Plus, FB's 30-day IV skew ranks in the 22nd percentile of its 12-month range, meaning calls have rarely been more expensive than puts, on a volatility basis.
Outside of the options pits, analysts are mostly upbeat toward Facebook, with 29 of 30 maintaining a "buy" or better rating, and not a single "sell" on the books. And following a recent rush by several brokerages to lift FB price targets, the average 12-month price target of $233.08 is an 8.9% premium to current levels.
Looking at the charts, FB shares have been surging up the charts since bouncing near the $150 mark last March -- its lowest point since July -- a region that corresponds to four times the FAANG stock's initial public offering (IPO) price. More recently, the security has been guided higher by its 30-day moving average, and is now boasting a 21.4% year-to-date gain.
