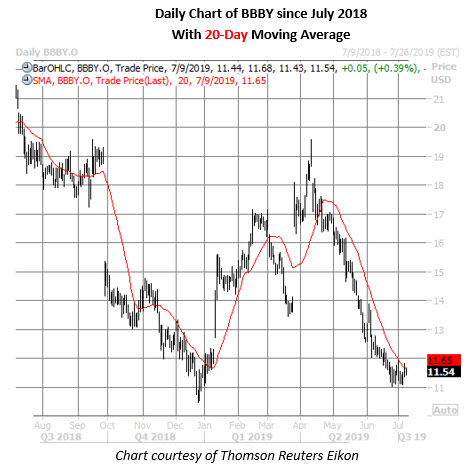
Bed Bath & Beyond Inc. (NASDAQ:BBBY) has been relatively quiet on the charts over the past month, per the stock's 30-day historical volatility of 30.6% -- in the tame 22nd annual percentile. However, that could all change once the retailer steps into the earnings confessional after the close tomorrow, July 10, considering BBBY stock has a history of making major post-earnings swings.
In fact, over the past eight quarters, the retail stock has averaged a single-session swing of 13.8%, regardless of direction, in the session following the company's quarterly earnings announcement. Seven of those eight earnings reactions have been negative, including an 8.8% drop in April. This time around, the options market is pricing in a 21.6% swing for Thursday's trading.
Despite the stock's dismal post-earnings history, call buyers have been more active than usual in recent weeks. At the International Securities Exchange (ISE), Chicago Board Options Exchange (CBOE), and NASDAQ OMX PHLX (PHLX), BBBY's 10-day call/put volume ratio of 3.18 ranks in the 77th annual percentile, meaning calls have been bought to open over puts at an accelerated clip.
Drilling down, the July 12 call has seen a notable rise in open interest over this two-week time frame, with nearly 11,000 contracts added. Data from the major options exchanges confirms buy-to-open activity here, meaning speculators are bracing for a rally above $12 by front-month options expiration at the close next Friday, July 19.
While it's possible some of this activity came at the hands of traditional bulls, it's more likely shorts picked up some options insurance to hedge against any upside risk. The 59.1 million BBBY shares controlled by shorts account for a whopping 48.3% of the available float, or 14.4 times the average daily pace of trading.
Shorts have certainly been in the driver's seat on BBBY stock for some time. Year-over-year, the retail shares have surrendered more than 45%, and are down almost 41% from their mid-April peak at $19.57. While the $11 region has emerged as a floor during this recent slide, the 20-day moving average is flexing its muscle as resistance. Today, Bed Bath & Beyond stock is up 0.4% to trade at $11.54, after an earlier run-up to its 20-day trendline.

