The back and forth in the Brexit and US-China trade news flows are hands down the two main topics of discussion driving financial markets this week. The recent out performance of the Pound or the sharp depreciation of the Yen clearly reveal what the intentions of the market have been so far, that is, buy into the premise of hope for a comprehensive deal with China and an unlock of the Brexit stalemate.
Quick Take
By checking the chart attached in the report below, where I depict the performance of each individual currency vs a pack of G8 FX, what should be most immediately noticeable is the out sized fluctuations in the value of the Pound and the Yen as a by-product of the relative optimism that surrounds the US-China trade and Brexit negotiations. The rest of currencies remain encapsulated in a rather compressed manner, although by distilling the more micro movements, we can observe a well-bid tone especially in the AUD and CAD, which again, is a reflection of a market more keen on seeking out exposure into long carry trades, even if these days the positive swap in the AUD is not what it used to be. The Kiwi, surprisingly, has been a notable under-performer even if the positive rhetoric would suggest greater demand flows were to be expected. The USD and CHF, while not punished to the same extend as the CHF, not even close, have also shown bearish tendencies as of late. Lastly, the EUR has been rather uneventful in the last 24h.
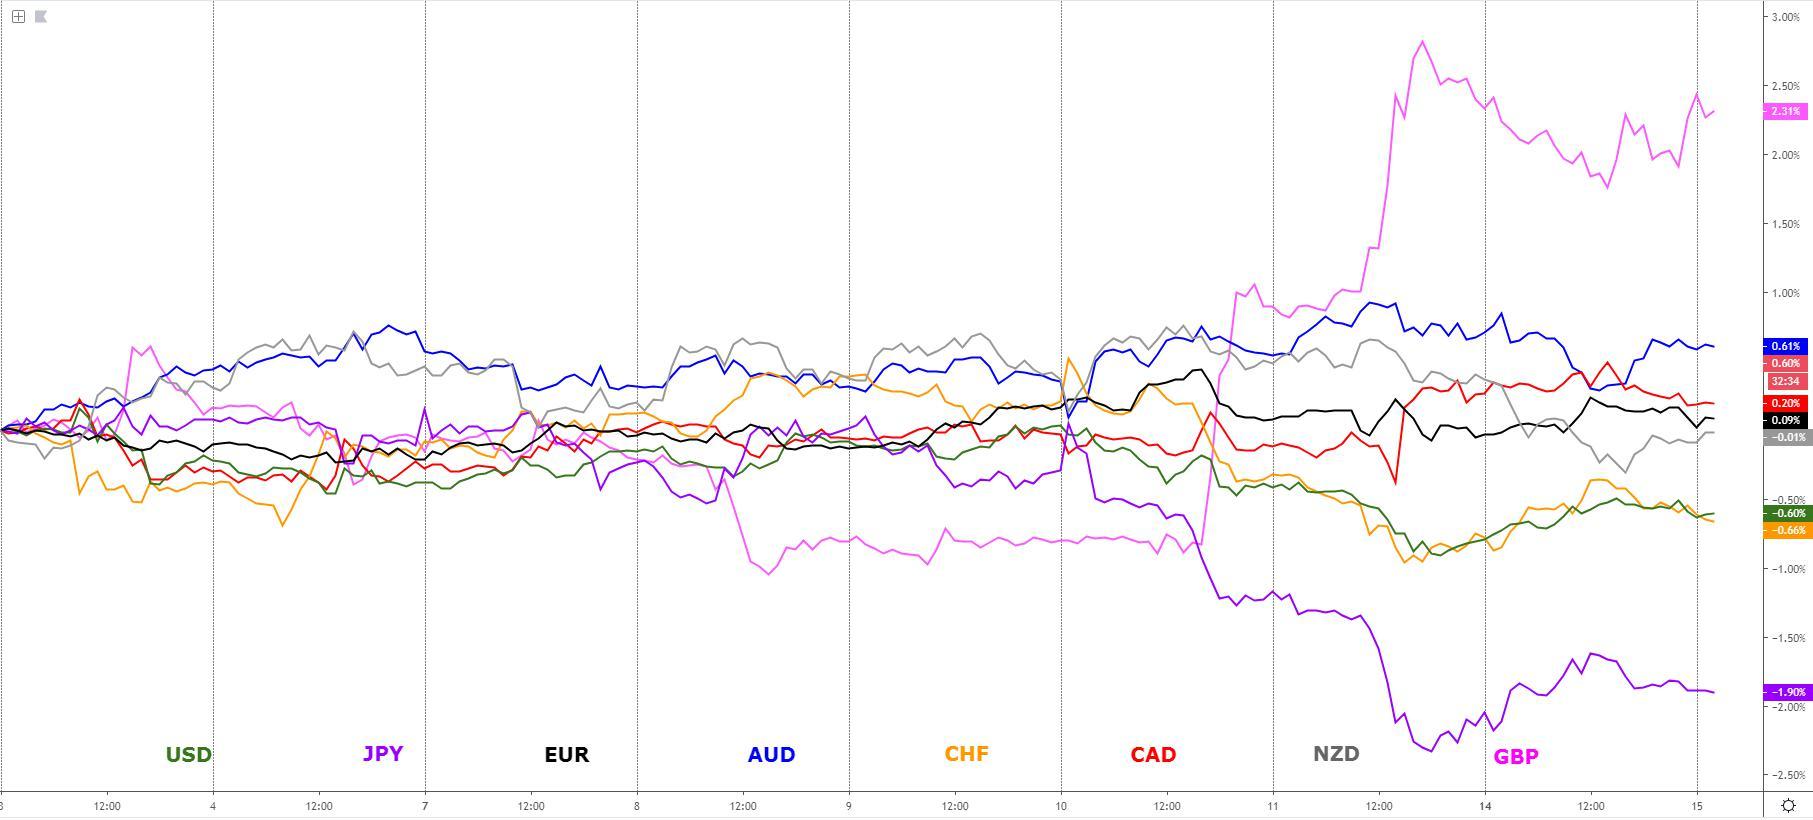
The indices show the performance of a particular currency vs G8 FX. An educational video on how to interpret these indices can be found in the Global Prime's Research section.
Narratives In Financial Markets
* The Information is gathered after scanning top publications including the FT, WSJ, Reuters, Bloomberg, ForexLive, Institutional Bank Research reports.
More talks ahead in the US-China saga? We had a bit of a hiccup in the one-way street risk appetite after Bloomberg reported that China is aiming for more talks before signing Trump's 'Phase One' deal before the Chinese President Xi Jinping accepts the signing ceremony, most likely at the Asia-Pacific EC summit next month in Chile.
China wants Dec tariffs scrapped: The report notes that China wants Trump to suspend indefinitely the planned tariff hike in December, although the US is adamant to agree on that request, according to Treasury Secretary Steven Mnuchin, unless a deal is written in coming weeks.
China's MoC hints deal not yet finalized: China’s Ministry of Commerce came out with a statement in which it somehow doesn't seem to imply that a deal is fully finalized, noting that “the two sides have made substantial progress” and “agreed to work together in the direction of a final agreement.”
Both sides willing to reach a deal: The initial negative reaction in risk sentiment on Monday was later reversed as the market seems to have come to terms that the news does not represent a major setback but rather, it's still seen as a glass half full with China obliviously wanting to get the most out of it as part of a context where both parties do seem willing to reach a deal.
Thin liquidity in the North American session: What may have influenced the lack of follow through risk-off mood, as manifested during the European hours, where equities did come under renewed sell-side pressure, is the fact that markets in the North American region were closed in observance of Columbus day.
Global Times Editor sounds optimistic: Another factor influencing the recovery in risk high-beta currencies in general is a tweet by the Global Times Editor, Hu Xijon, who suggested that China will live up to the agreed commitment. The tweet read: “China has the market demand to buy $40bn-$50bn worth of US farm products. China won’t make a commitment that it can’t honor.”
PBOC gives blessing to US-China talks? Adding to the positive vibes in the Aussie away from its recent low is the fact that today's PBOC fix saw a slight appreciation of the CNY, which one could read as the PBOC (Chinese government-controlled entity) supporting the outcome of the US-China trade talks via the gesture of a higher Yuan.
RBA dovishness intact: Today's RBA minutes continues to show a Central Bank leaning towards a firm easing bias, noting that they are "prepared to ease further if needed to support growth and jobs." The RBA remains caution on its tone, detailing as part of the statement that "leading indicators point to slowdown in jobs growth in quarters ahead."
Trump set to impose big sanctions to Turkey: Trump said big sanctions on Turkey are coming in response to the strikes in the northern part of Syria last week. The Turkish Lira remains under pressure as the upcoming sanctions are set to exert further strains in an already debilitated economic outlook.
Chinese trade figures show weak demand: China trade balance data came very poor on Monday, with imports and exports both lower than expected. In USD terms, the exports were down by -3.2% y/y while the decline in imports was much more dramatic, with a fall of 8.5% y/y, which implies weak domestic demand and understandably, led to an initial negative reaction in the Oceanic currencies, although a stubborn Aussie managed to weather the storm. The Kiwi didn’t show as much conviction.
The Sterling holds firm as Brexit hopes remain: The Pound is holding firm near its highest levels after the Telegraph reports that Brexit deal hopes keep rising as 'last-minute compromises are made'. The report expands that “sources in Brussels and London told The Daily Telegraph there was cautious optimism that a narrow path to a deal could now be appearing - a marked shift in tone from the downbeat assessment from the EU’s chief negotiator Michel Barnier on Sunday.” A source, according to the news portal, said "a positive day of negotiations had yielded a potential solution to the Northern Irish border.”
Finnish PM has thrown some cold water: The politician said the prospects of an immediate deal, if there were to be one, are not easy after detailing the following statement “I think there is no time in a practical way and in a legal base to reach an agreement before the Council meeting”.
Recent Economic Indicators & Events Ahead
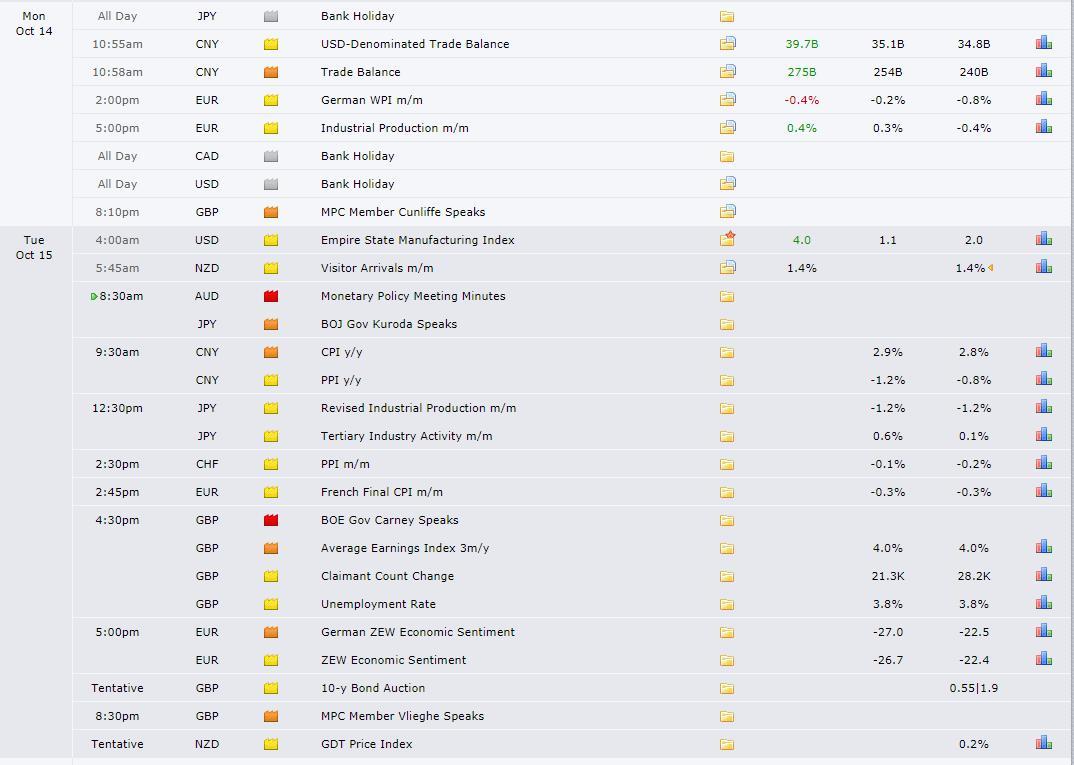
With the RBA Minutes out of the way, Aussie traders now look forward to Thursday’s jobs data in Australia. New Zealand, sees the publication of the CPI figures on Wednesday. In the US, focus will be on the earnings season kicking off on Tuesday, which should be the main driver for stocks, hence act as a major driver for the likes of the Yen on ris on/off. Brexit will definitely be another focal point, as the market awaits headlines from the 17-18 October UK-EU Summit. The base case by the market is that an extension will be followed by fresh elections. Other data points of interest include US Retail Sales on Wednesday or China’s Q3 GDP and other monthly activity indicators on Friday.
Source: Forexfactory
A Dive Into The FX Indices Charts
The indices show the performance of a particular currency vs G8 FX. An educational video on how to interpret these indices can be found in the Global Prime's Research section.
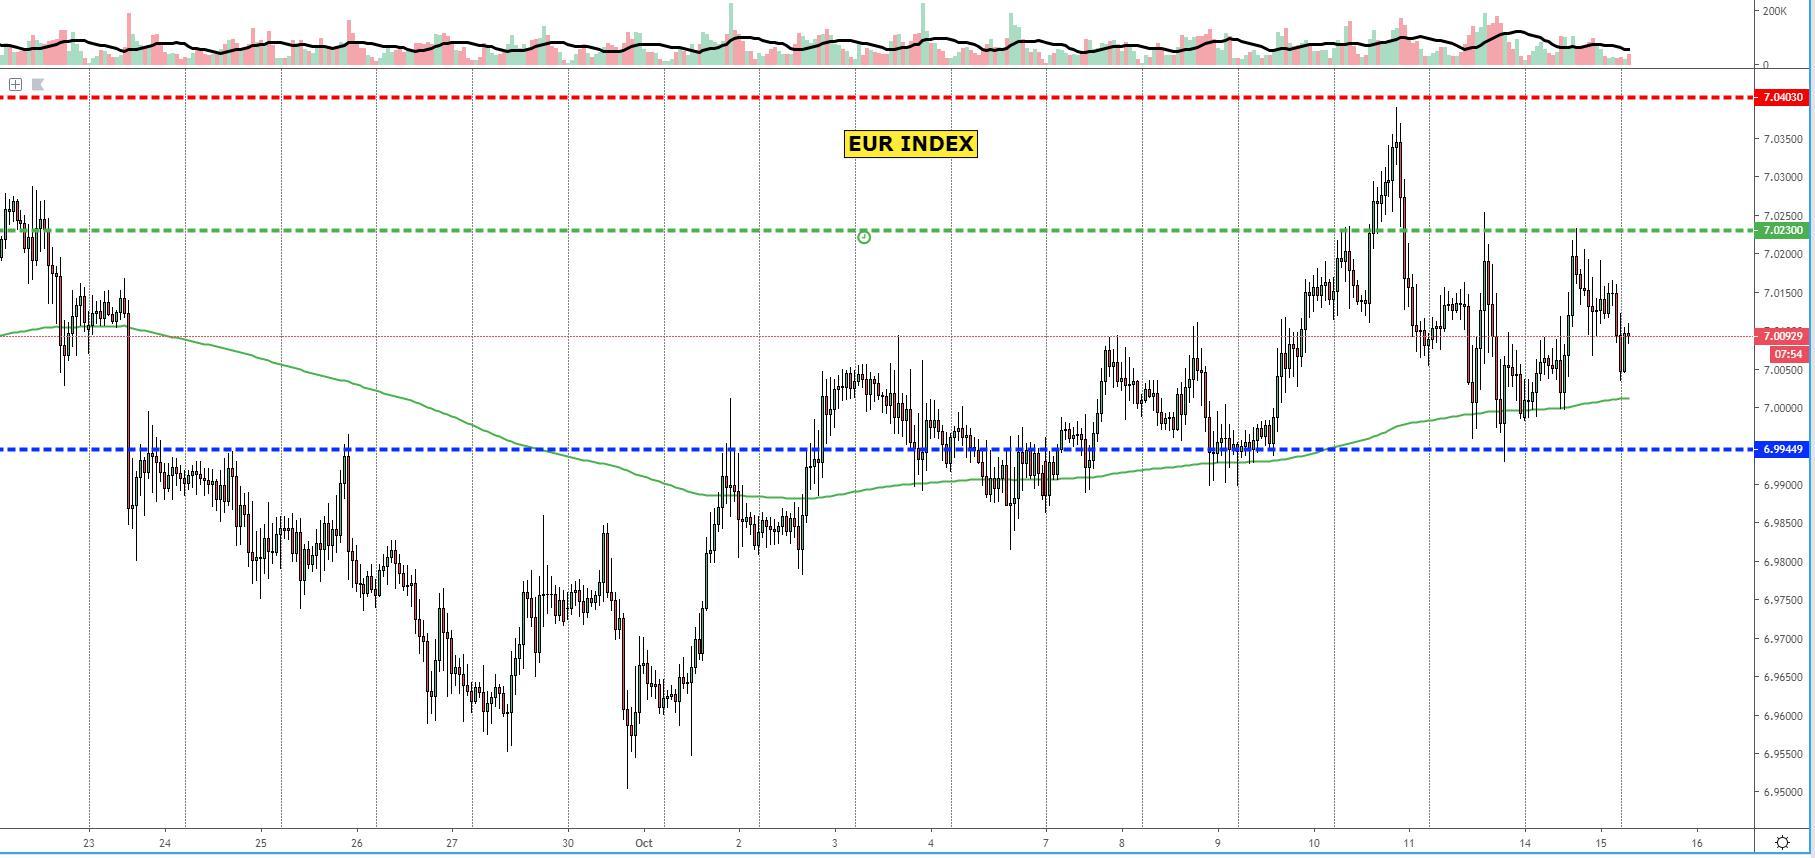
The EUR index has entered a range period, encapsulated between a level of hourly resistance, tested and rejected during Monday’s activity, while the downside remains firmly capped by an area identified as a level of support on the mid-term chart (6h time frame). The index was recently rejected from a daily resistance level, which means it could have been an inflection point from where a more protracted sell-side cycle sets out to mature. So far, the reaction off this daily resistance suggest this scenario still coming to fruition, although much will depend on whether or not supply imbalances can violate the 6h support level in blue and accept below.
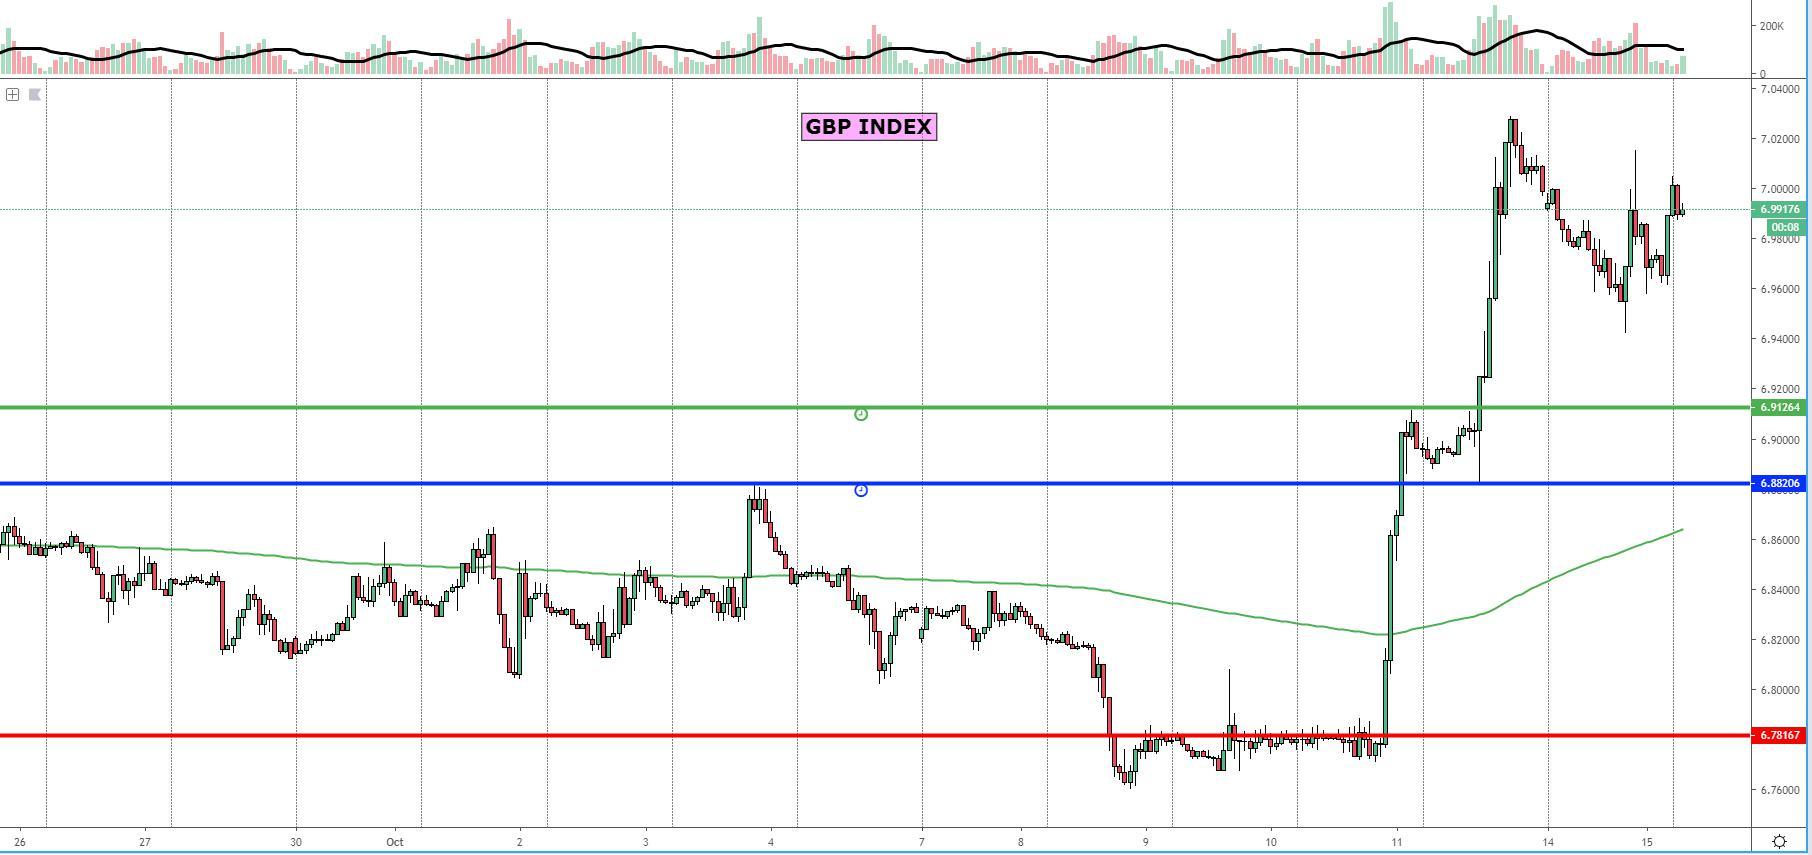
The GBP index continues to find demand at these present lofty levels as algo-led buying tries to get onto the bandwagon of the GBP frenzy after a report by the Telegraph feeds into the rhetoric that a potential compromise on the Irish border may still be found. The level the currency trades at remains exceedingly expensive but in a week where headlines will take the driving seat, anything can happen, including the further elongation of the momentum on Brexit positives. Should any setback occur, I’ve identified critical levels of support further down at a significant distance from price, which makes them key pockets of demand imbalances to re-engage in GBP.
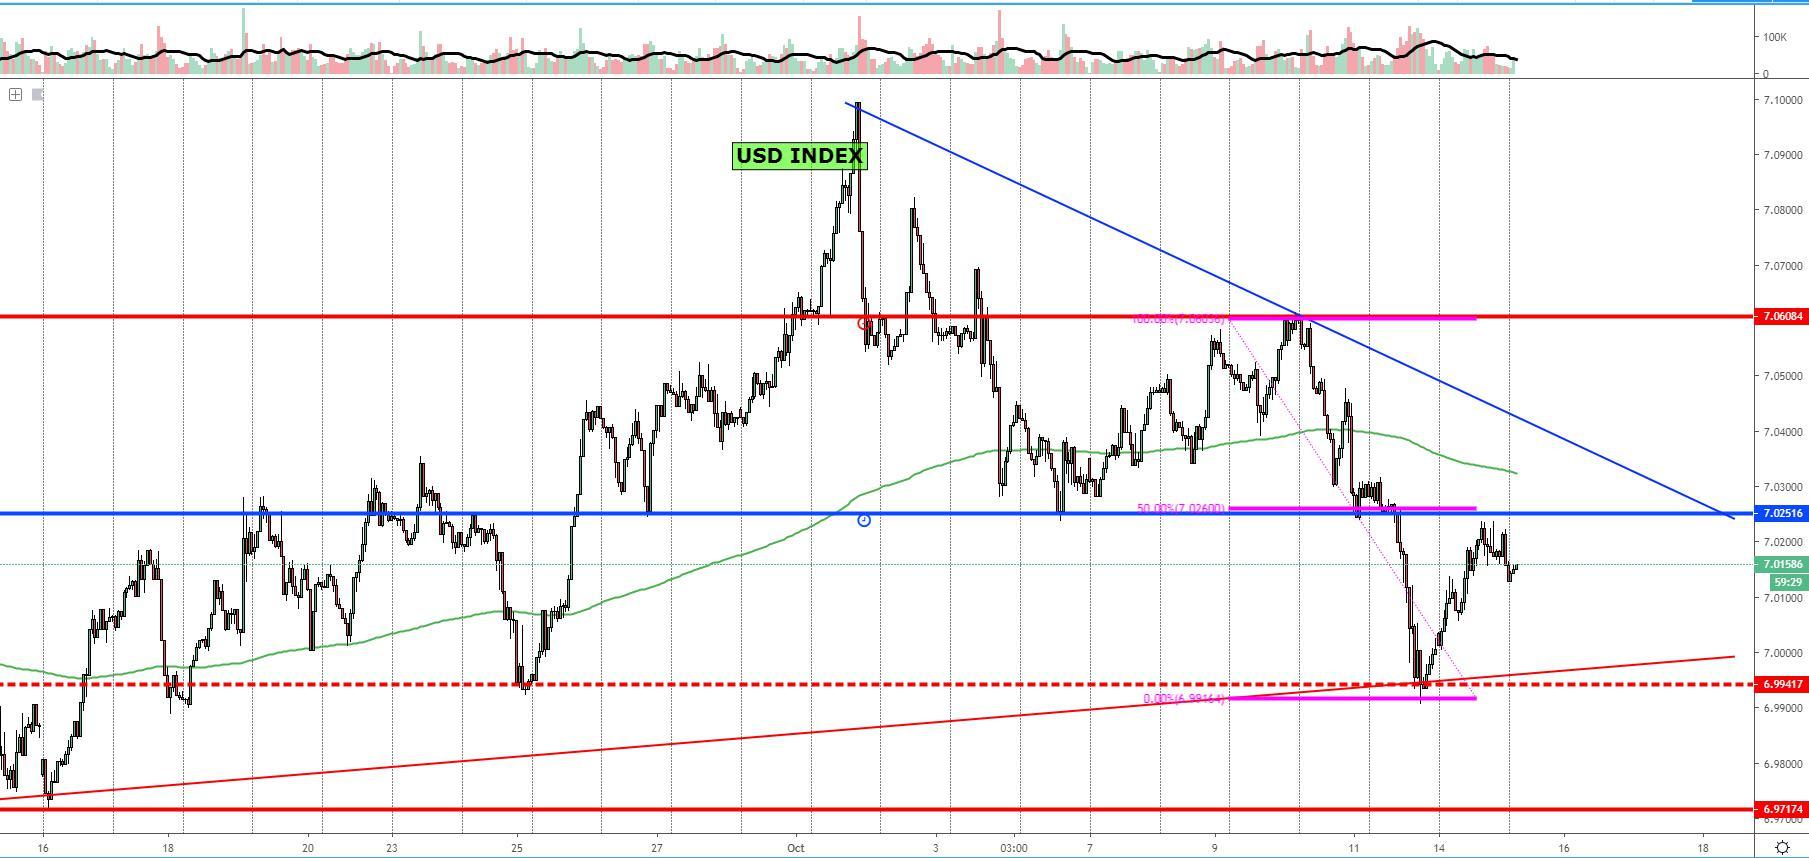
The USD index found a solid level of demand imbalance as I was anticipating at a huge confluence area (100% measured move, daily horizontal support + trendline intersection), which means plenty of eyes would have been looking to re-engage around this level. The bounce initiated off this strong demand level has shot up towards a level of horizontal resistance in the 6h chart, where sitting offers in G8 FX and represented via the aggregation of flows, implied that sellers would be temporarily gaining the upper hand again, as was the case. With both levels now tested on either side (hence why painted in dash lines), I’ll wait for new levels of clear strong departures to set up in line with the dominant flows before speculating in either direction.
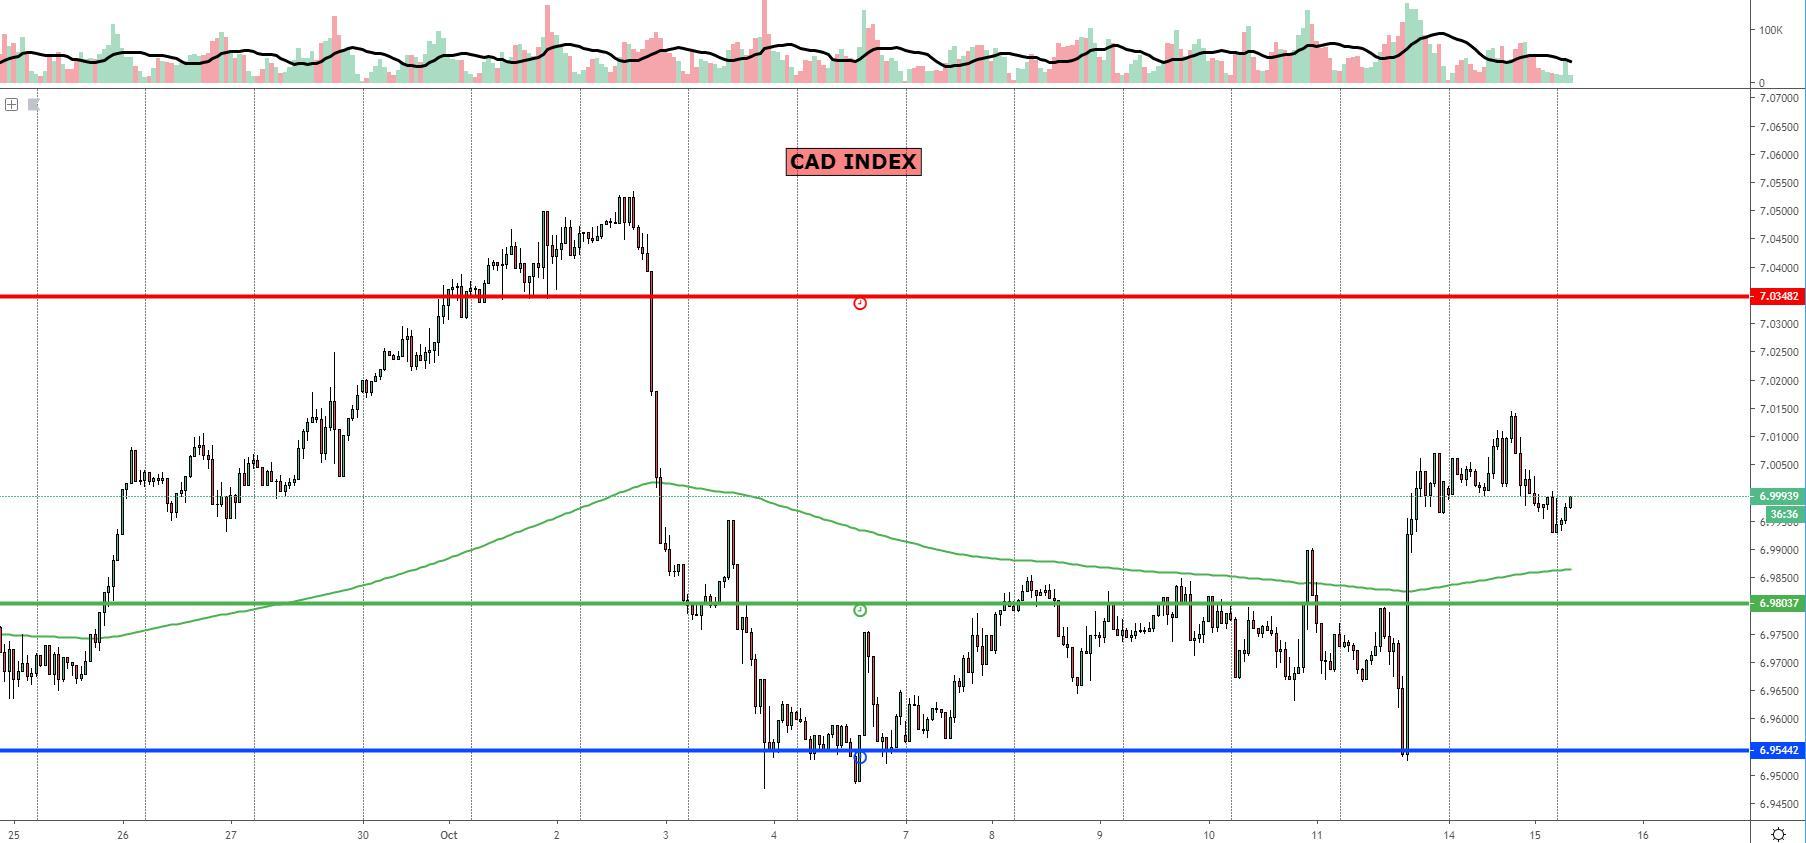
The CAD index could not sustain an expansion of its bullish momentum into the close of the daily candle, even if the structure is still quite conducive to see demand follow through on dips. The positive fundamentals on the CAD, after the sizzling hot employment report last Friday, are an extra factor backing up the appreciation in the currency, as is the overall risk appetite prevailing after last week’s tentative US-China trade agreement. There are a couple of selected horizontal support levels that were identified on setback off the hourly and 6h chart. On the way up, there is significant room until the next level of daily resistance (see red line).
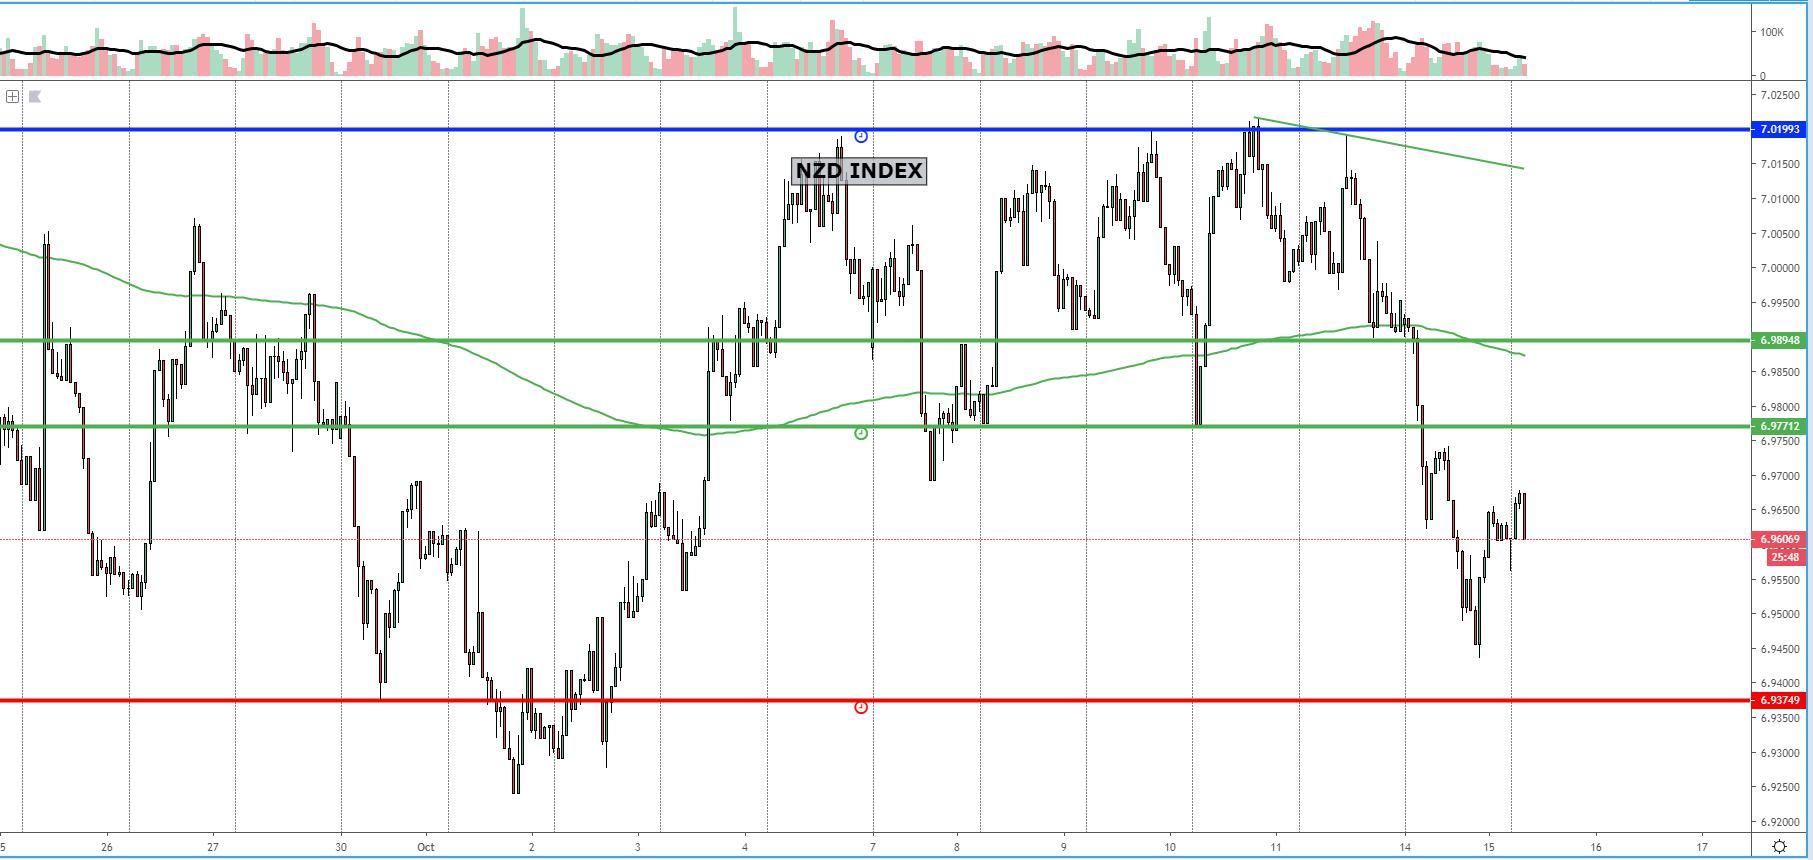
The NZD index has breached an important swing low in the hourly chart, allowing the creation of a fresh bearish leg visible from the 6h time frame. This now sets the stage for sellers to be the dominant force in this market, especially as the market seeks out higher liquidity pockets. I’ve highlighted a couple of hourly resistance levels where sell-side pressure may return, with the most distant of special significance as the baseline off the daily aligns with the origin of Monday’s supply imbalance. On the downside, should the momentum resume, there is room for the NZD to keep selling until faced with a fresh level of daily horizontal support.
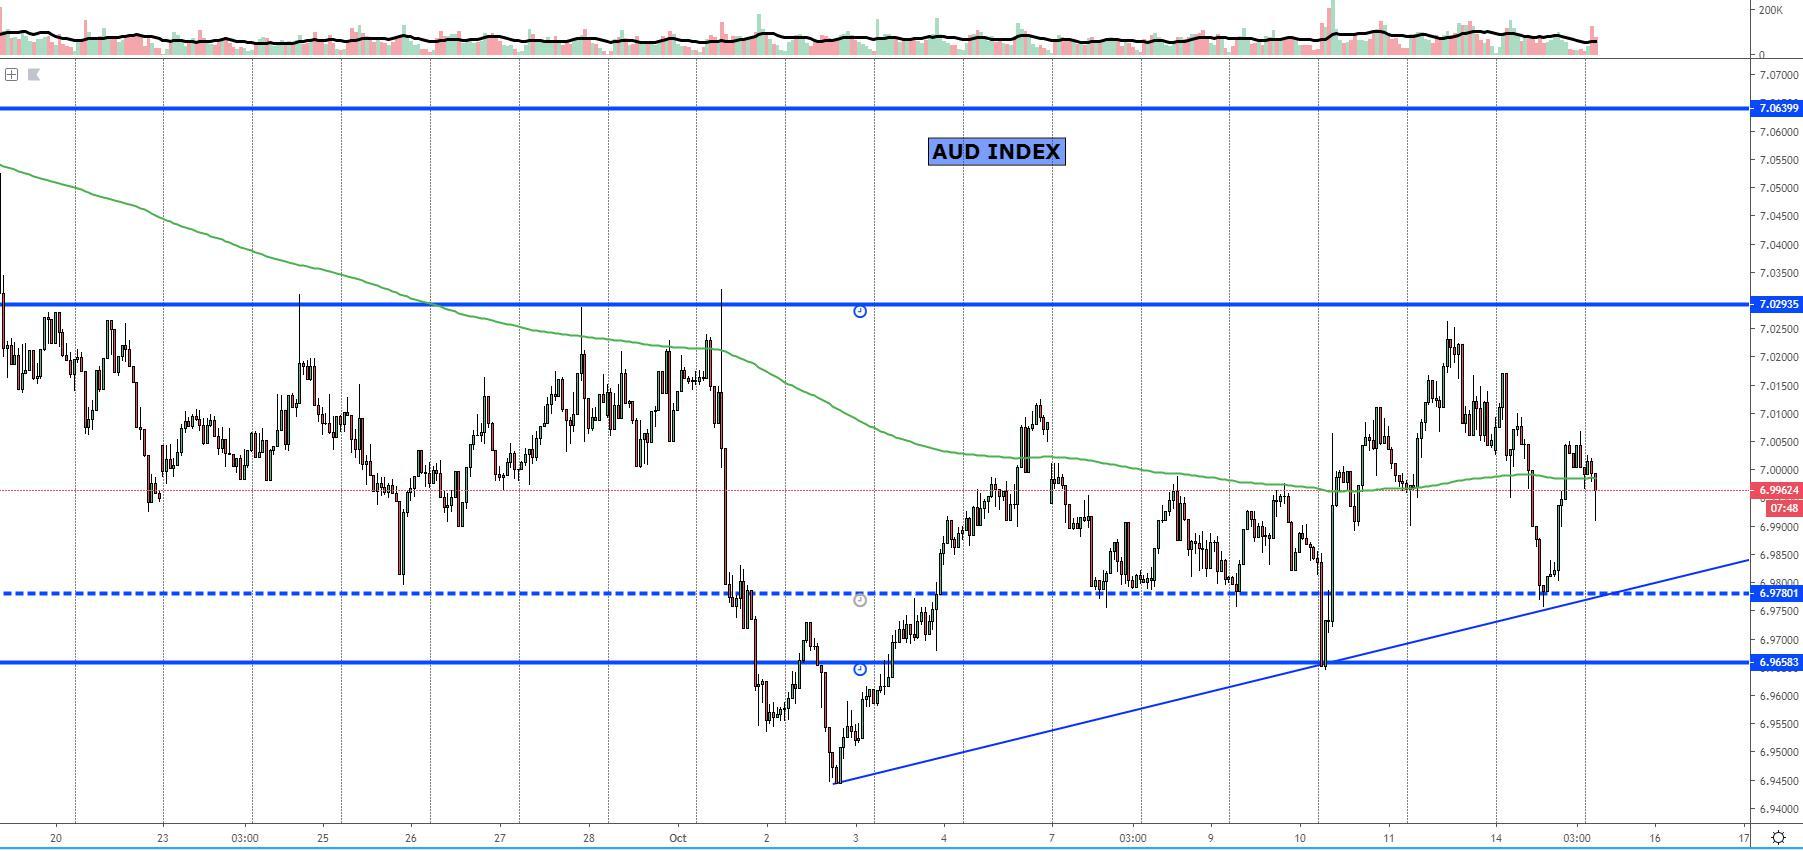
The AUD index was convincingly rejected off a critical level of support outlined in blue as it represented not only a level with multiple interaction but also a key juncture as per the intersecting bullish trendline paired with the origin of demand from Oct 11. With the downside level now probably consumed, should further setback come about, there is another critical level of horizontal support off the 6h chart down below where I expect demand to arise as it was a precursor to the Aussie breaking into a new swing high in that 6h chart. On the topside, a sticky level of horizontal resistance, while still at a fair distance away, must be accounted for as an area that will most likely cause a potential supply imbalance as was the case during Sept.
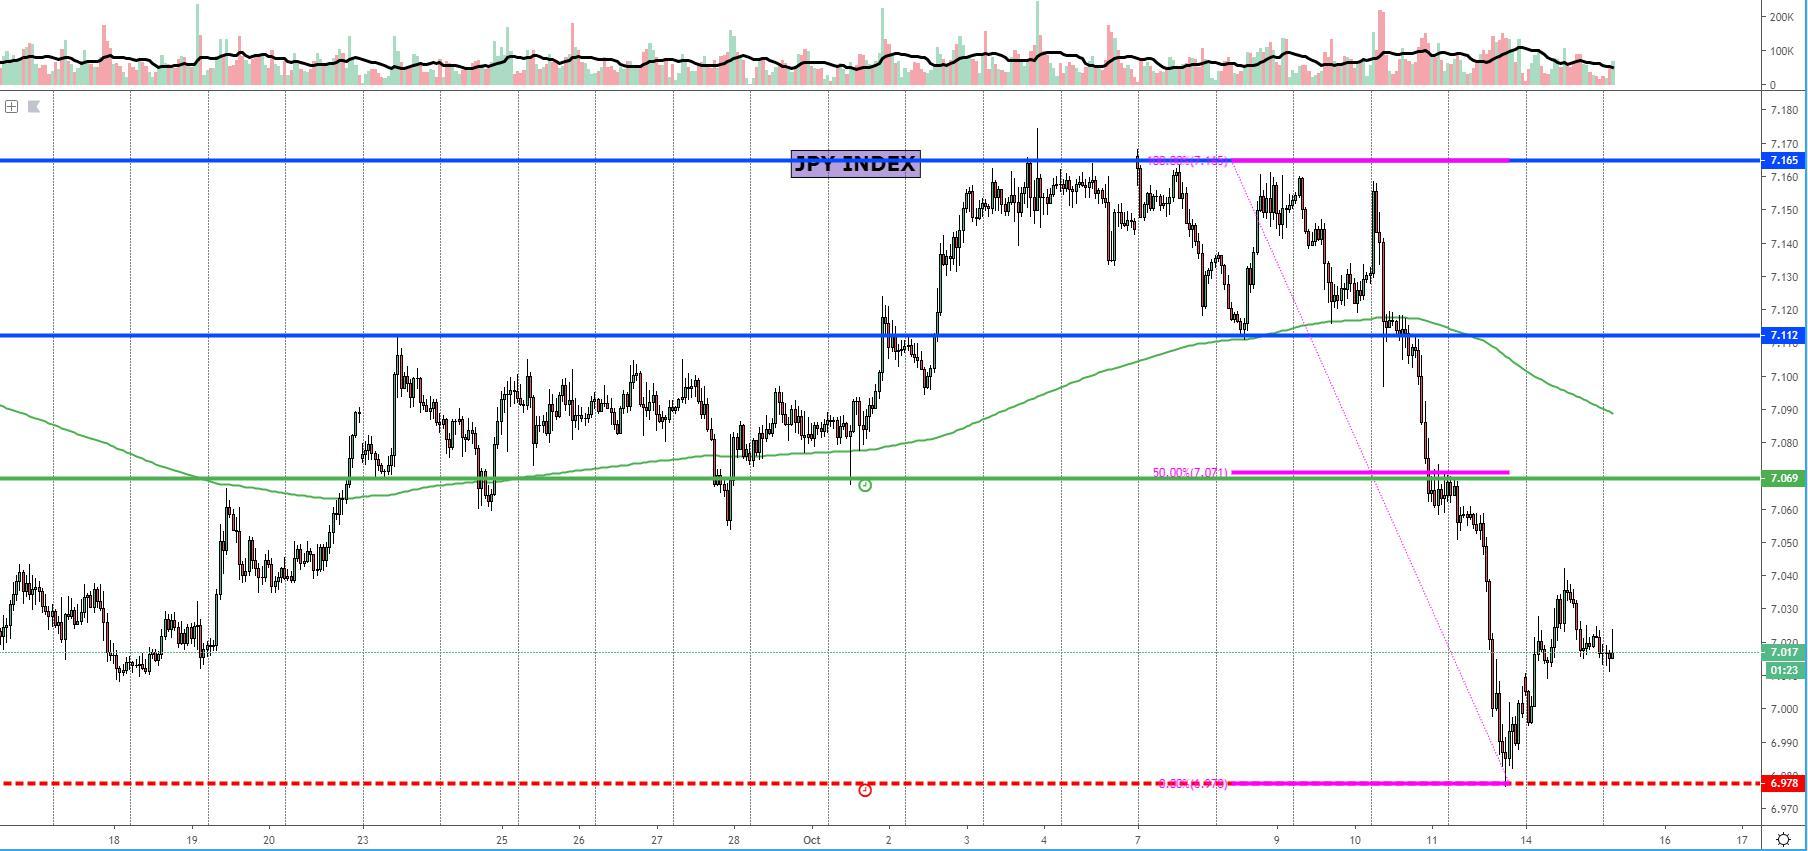
The JPY index saw a 3 leg corrective move off a daily horizontal support, with the price now in no man’s land in terms of the proximity with demand/supply imbalances. This means we must await for further price fluctuations to show the next directional path. However, be aware that the level of demand in the daily has now taken control, which is where a meaningful buy-side campaign may set out towards the next technical level of relevance, currently not see until the 50% retracement of the sharp decline from last week (highlighted in green). In the short-term, the absence of near-by levels allows enough room to see the exploitation of voids in either side.
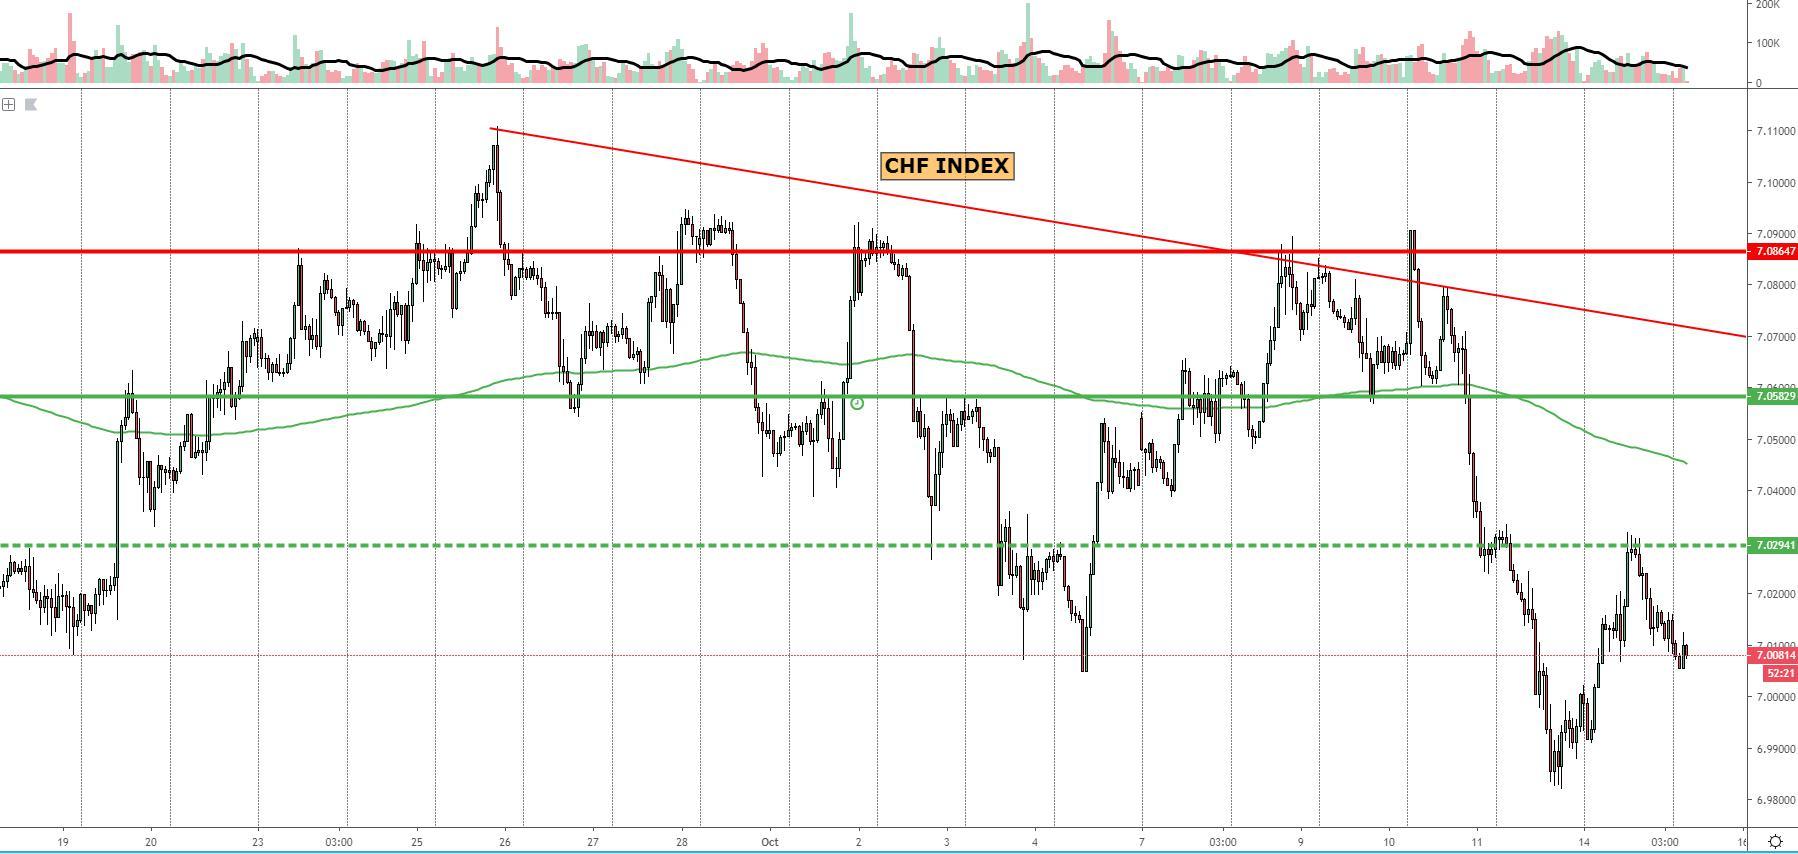
The CHF index found enough demand to revisit a key level of liquidity in the chart where a supply imbalance had originated off the hourly last Friday, and precisely the area where the corrective leg in the Swissy has come to a temporary end. There is currently a lack of fresh levels of support/resistance nearby to make me consider any area in the chart as tradable, so as in the case of the Yen index, patience for new demand/supply imbalance formation is warranted.
Important Footnotes
- Risk model: The fact that financial markets have become so intertwined and dynamic makes it essential to stay constantly in tune with market conditions and adapt to new environments. This prop model will assist you to gauge the context that you are trading so that you can significantly reduce the downside risks. To understand the principles applied in the assessment of this model, refer to the tutorial How to Unpack Risk Sentiment Profiles
- Cycles: Markets evolve in cycles followed by a period of distribution and/or accumulation. To understand the principles applied in the assessment of cycles, refer to the tutorial How To Read Market Structures In Forex
- POC: It refers to the point of control. It represents the areas of most interest by trading volume and should act as walls of bids/offers that may result in price reversals. The volume profile analysis tracks trading activity over a specified time period at specified price levels. The study reveals the constant evolution of the market auction process. If you wish to find out more about the importance of the POC, refer to the tutorial How to Read Volume Profile Structures
- Tick Volume: Price updates activity provides great insights into the actual buy or sell-side commitment to be engaged into a specific directional movement. Studies validate that price updates (tick volume) are highly correlated to actual traded volume, with the correlation being very high, when looking at hourly data. If you wish to find out more about the importance tick volume, refer to the tutorial on Why Is Tick Volume Important To Monitor?
- Horizontal Support/Resistance: Unlike levels of dynamic support or resistance or more subjective measurements such as fibonacci retracements, pivot points, trendlines, or other forms of reactive areas, the horizontal lines of support and resistance are universal concepts used by the majority of market participants. It, therefore, makes the areas the most widely followed and relevant to monitor. The Ultimate Guide To Identify Areas Of High Interest In Any Market
- Trendlines: Besides the horizontal lines, trendlines are helpful as a visual representation of the trend. The trendlines are drawn respecting a series of rules that determine the validation of a new cycle being created. Therefore, these trendline drawn in the chart hinge to a certain interpretation of market structures.
- Fundamentals: It’s important to highlight that the daily market outlook provided in this report is subject to the impact of the fundamental news. Any unexpected news may cause the price to behave erratically in the short term.
- Projection Targets: The usefulness of the 100% projection resides in the symmetry and harmonic relationships of market cycles. By drawing a 100% projection, you can anticipate the area in the chart where some type of pause and potential reversals in price is likely to occur, due to 1. The side in control of the cycle takes profits 2. Counter-trend positions are added by contrarian players 3. These are price points where limit orders are set by market-makers. You can find out more by reading the tutorial on The Magical 100% Fibonacci Projection
