AUD/USD Hit A Critical Support
AUD/USD plunged and resumed the bearish momentum as the USD received a helping hand from the United States data. Price reached a major dynamic obstacle, where has found temporary support again. Is trading in the red as the dollar index stays above the 93.50 psychological level, the index will climb towards new highs if the United States data will come in line with expectations or better. You should keep an eye on the economic calendar in the afternoon to see what will drive the rate.
Aussie dropped on the poor Chinese and Australian numbers, but has squeezed a little in the last hours. The Chinese CPI rose by 1.4% in July, less compared to the 1.5% estimate, while the PPI surged only by 5.5%, despite that the traders have expected to see a 5.6% growth. Moreover, the Australian Home Loans surged by 0.5%, less compared to the 1.5% estimate and versus the 1.1% growth in the former reading period, while the Westpac Consumer Sentiment dropped by 1.2% in August from the 0.4% in July.
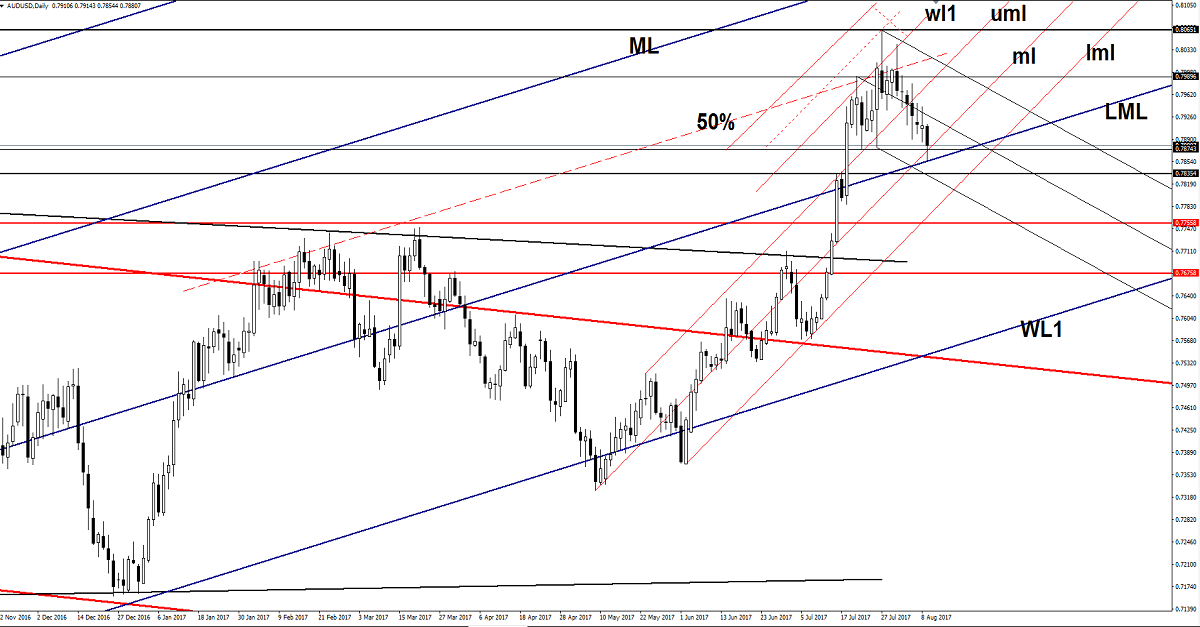
Price dropped and touched the lower median line (LML) of the major ascending pitchfork, where has found strong demand. Has broken below the 0.7874 static support, but wasn’t able to stay there as the dollar index looks ready to decrease a little again.
AUD/USD dropped also below the median line (ml) of the minor ascending pitchfork, but right now we have only a false breakdown. The current decrease is natural after the false breakout above the 50% Fibonacci line (ascending dotted line) and above the warning line (wl1) of the minor ascending pitchfork.
You can see that I’ve drawn a minor descending pitchfork to catch a potential downside movement, price retested the median line and now could try to reach the lower median line of the mentioned support levels will cave in.
NZD/USD Extends The Sell-Off
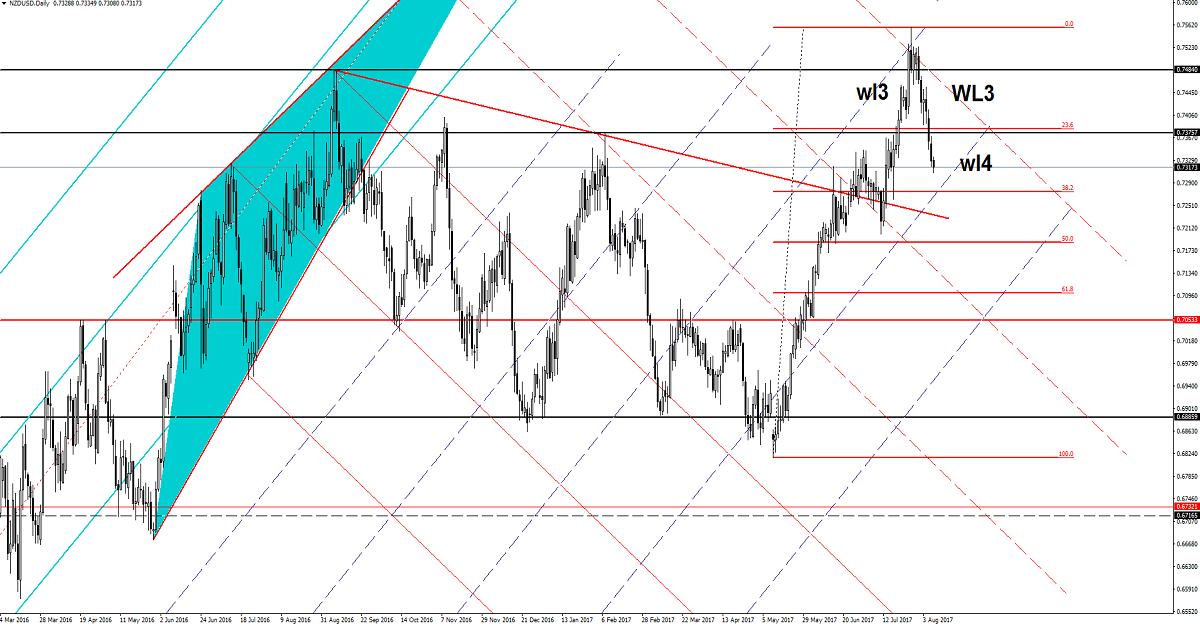
Price drops like a rock and looks unstoppable on the short term. Is trading near the 0.7320 level and should drop further. NZD/USD is seeking for strong support and could find one at the fourth warning line (wl4). Could be attracted by the confluence area formed at the intersection between the warning line (wl4) and the 38.2% retracement level.
EUR/GBP False Breakout?
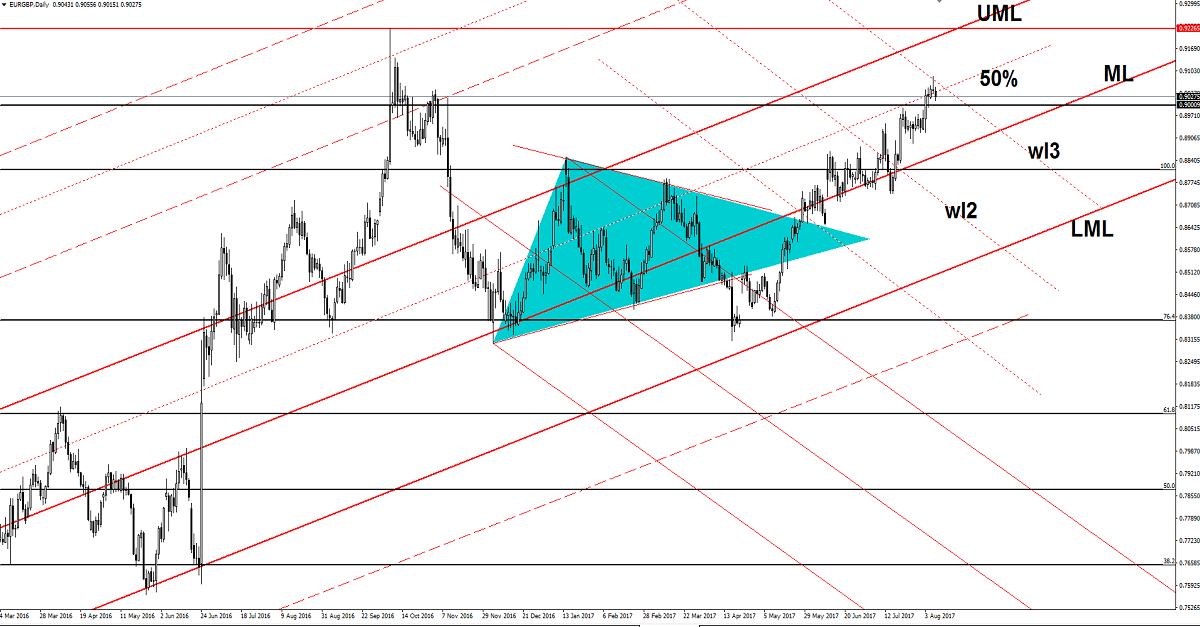
EUR/GBP drops after the false breakout above the 50% Fibonacci line (ascending dotted line). Could come down to retest the 0.9000 psychological level before will try to resume the upside movement. We have a bullish bias on the Daily chart, but a drop below the psychological level will open the door for a drop towards the median line (ML) of the major ascending pitchfork. Resistance can be found at the wl3 as well.
Risk Disclaimer: Trading in general is very risky and is not suited for everyone. There is always a chance of losing some or all of your initial investment/deposit, so do not invest money you can afford to lose. You are strongly advised to carry out your independent research before making any trading decisions. All the analysis, market reports posted on this site are only educational and do not constitute an investment advice or recommendation to open or close positions on international financial markets. The author is not responsible for any loss of profit or damage which may arise from transactions made based on any information on this web site.


