- CME forced to pause trading due to selling pressure
- 10-year yields drop below 2.9 percent, underpinning rising recession risk
- Oil slips below $52 a barrel, completes hourly-top reversal
- BOJ’s Kuroda, Fed's Beige Book highlight fading growth prospects
Key Events
Global stocks sold off this morning and futures on the S&P 500, Dow and NASDAQ 100 slumped at the Asian open, pressuring CME—which operates the US futures and options exchange—to intermittently halt trading. US Treasurys jumped, boosting the dollar, as investors shifted to risk-off on multiple macro headwinds, including a high-profile arrest linked with US sanctions against Iran.

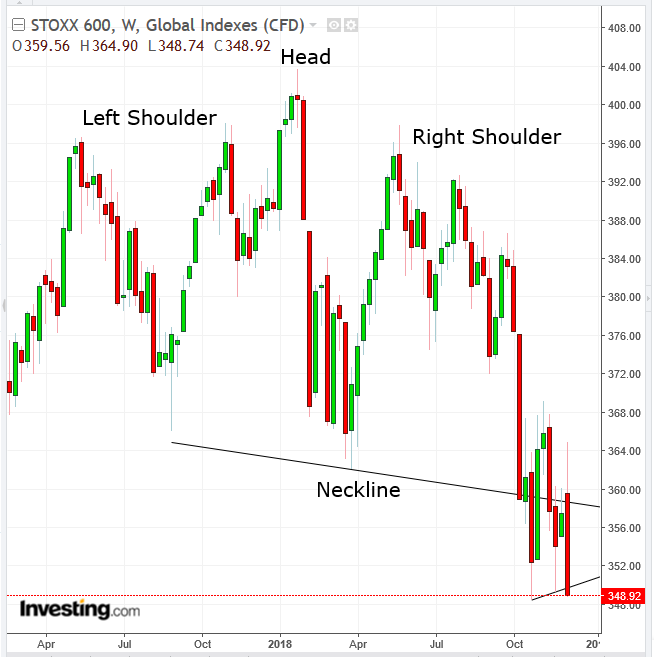
The STOXX Europe 600 gapped down 0.74% on open and extended its slide to 2.26% by late European morning, with all sectors in red territory. The pan-European benchmark's 4.4% plunge since Monday's peak marks the biggest three-day loss from its highest levels since early November to its lowest levels since December 2016. Technically, the index completed, subject to a close confirmation, an H&S continuation pattern since mid-October, bearish in a downtrend. Even more worryingly, it is signaling the end of a return move to a massive H&S top reversal since May 2017.
In the earlier Asian session, Hong Kong’s Hang Seng tumbled 2.47% after Huawei's CFO Meng Wanzhou was arrested by Canadian authorities on Saturday. The daughter of the Chinese smartphone and IT giant's founder faces extradition to the US, on allegations she violated US sanctions against Iran. The move threatens to end the current US-Sino trade ceasefire, re-initing fears over the strained negotiations between the two countries, and can therefore explain the US equity futures selloff.
Global Financial Affairs
Adding to triggers for the US futures plunge was the downbeat economic outlook posted by Bank of Japan's Governor Haruhiko Kuroda, who warned economic risks from abroad could be severe. Kuroda's remarks compounded the Federal Reserve’s Beige Book report, which showed fading optimism over growth prospects at US firms, even as most districts continued to report a modest expansion.

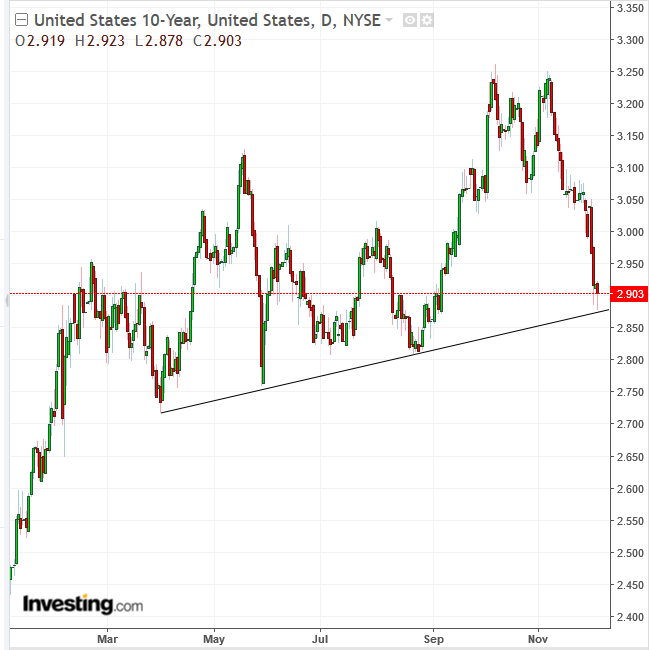
The general risk-off tone increased demand for US Treasurys, pushing the yield on 10-year notes below 2.9%. Ten-year yields reached the lowest level in almost three months upon paring most of today's decline, which brings them yet nearer to 2-year rates, underpinning worries that a yield curve inversion may soon herald an economic downturn.
Technically, today’s trading may be forming a bullish hammer, upon reaching the uptrend line since March—when the trade war started.

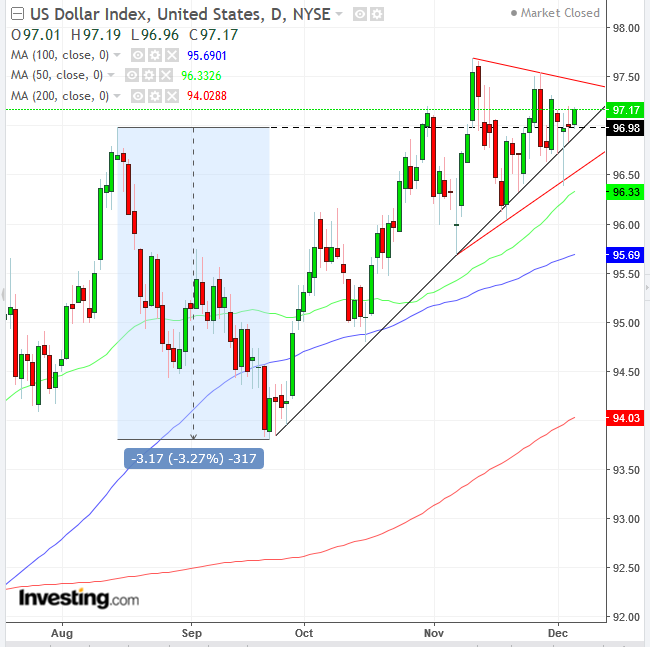
The dollar rebounded from earlier losses, despite the USD-negative equity selloff and a potential move by the EU to increase the use of the euro in the energy field, to become less dependent on the dollar.
The pound slipped lower as UK Prime Minister Theresa May sought a compromise to avoid a crushing defeat on her Brexit deal in a critical vote in Parliament next week. Should prices drop another half percentage point, cable will hit its lowest level in 18 months.

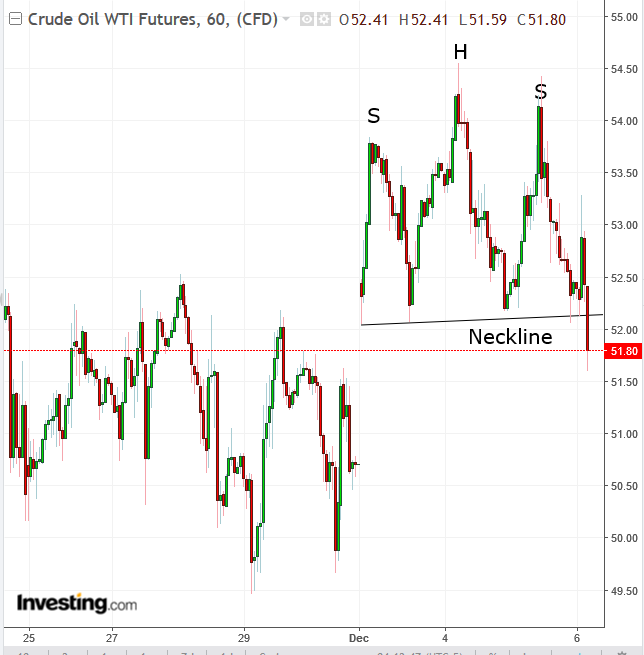
Oil fell below $52 as the much-anticipated OPEC summit kicked off in Vienna this morning, with production cuts at the top of the group's agenda. Technically, the price completed an H&S top reversal on the hourly chart, suggesting prices will retest the $50 psychological level.
Up Ahead
- OPEC ministers meet in Vienna Thursday and Friday
- ADP (NASDAQ:ADP) private-sector payrolls numbers come out today
- Also today, the ISM will release its measure of November non-manufacturing activity
- Friday sees the US monthly employment report for November
Market Moves
Stocks
- The UK’s FTSE 100 Index decreased 0.9 percent to the lowest level in two years.
- Germany's DAX declined 1.2 percent to the lowest level in almost two weeks on the most significant drop in more than two weeks.
- The MSCI Asia Pacific Index fell 1.8 percent to the lowest level in almost two weeks on the most substantial decrease in six weeks.
- The MSCI Emerging Market Index dropped 1.8 percent to the lowest level in more than a week on the biggest dip in more than six weeks.
Currencies
- The Dollar Index gained 0.1 percent to the highest level in more than a week.
- The euro slid 0.1 percent to $1.1328.
- The British pound declined 0.2 percent to $1.2706, the weakest level in 16 weeks.
- The Japanese yen advanced 0.1 percent to 113.06 per dollar.
Bonds
- The yield on 10-year Treasuries dropped less than one basis point to 2.91 percent, hitting the lowest level in three months with its sixth straight decline.
- Germany’s 10-year yield fell two basis points to 0.26 percent, the lowest level in more than six months.
- Britain’s 10-year yield slipped two basis points to 1.293 percent.
- The spread of Italy’s 10-year bonds over Germany’s rose three basis points to 2.8161 percentage points.
Commodities
- Gold fell 0.2 percent to $1,235.34 an ounce, the biggest fall in more than a week.
