- All Instrument Types
- Indices
- Equities
- ETFs
- Funds
- Commodities
- Currencies
- Crypto
- Bonds
- Certificates
Please try another search

OPEC Selling Snake Oil

Oil saw a decent rally over the last 24 hours on a report out from OPEC which the market looked upon as generally bullish. The report remained upbeat about global demand for this year and even saw it rising at a faster pace, which is all very well if you are an oil producing cartel. The only problem is that the economic data does not back this up.
The Organisation of the Petroleum Exporting Countries (OPEC) have raised their oil demand forecast for 2015 and now expect demand to increase by 1.18 million barrels per day to 92.5mbpd. This is up from 1.17mbpd in April and comes as a bit of a surprise given that economic activity all but ground to a halt in the US and China is doing all it can to keep the cogs turning. But then again, upping a demand forecast is going to increase the price you receive from the market, so maybe it’s not a surprise, but should be taken with a grain of salt.
US Advance GDP for Q1 2015 came in at a dismal 0.2% (annualised), having fallen from 2.2% in Q4 2014. This highlights the risks facing the US economy at the moment as the recovery once again begins to look shaky. China too is facing its own risks with its GDP growth rate threatening to fall below 7.0% for the first time in a number of years. The PBOC has responded to the threats of a slowdown by cutting interest rates and the reserve requirement ratio. If these trends continue, the OPEC’s oil demand forecast will certainly come under pressure.
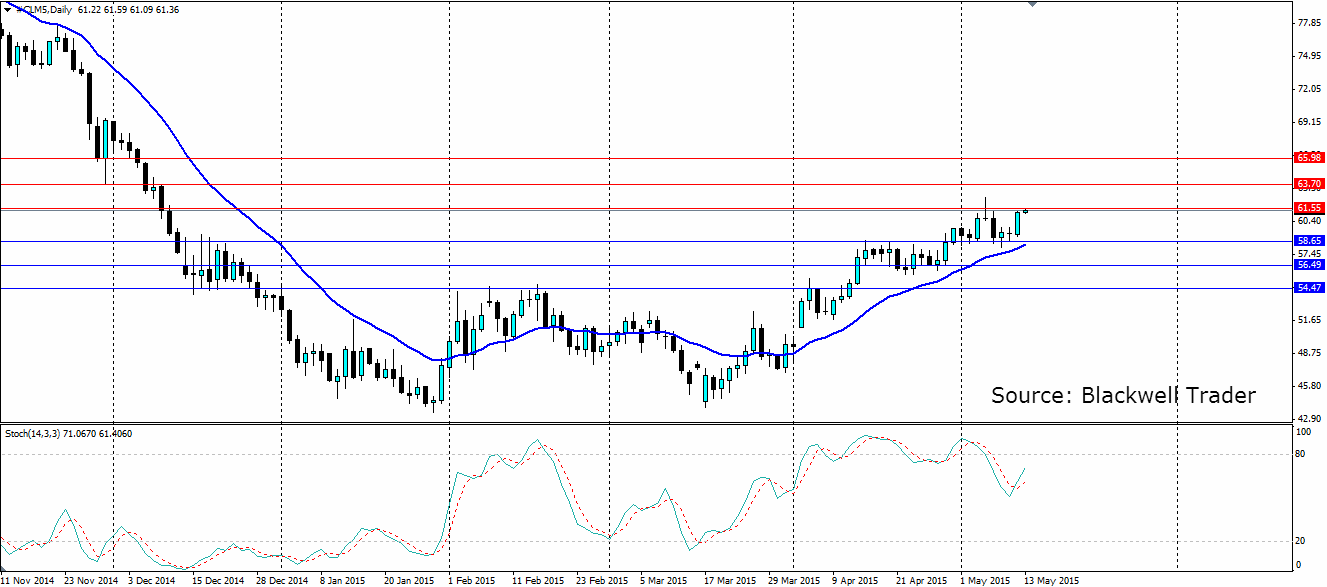
From a technical perspective, oil certainly is enjoying a bullish run but the recent top at 62.60 will need to be breached for it to continue. That candle was a reversal pattern that resulted in a solid rejection off the resistance there. We are creeping back toward that resistance area and if price fails to breach it, we could see a double top and the end to the current bullish trend.
The Stochastic oscillator has been forming lower highs while the price has been forming higher highs, indicating bearish divergence that could spell trouble for oil from a technical perspective. The price is sitting just under resistance at 61.55, with further resistance at 63.70 and 65.98. A move lower will look for support at 58.65, 56.49 and 54.47.
Related Articles

Will WTI crude oil hit 67.00 key level? MACD and stochastics indicate further losses WTI crude oil futures dived below the long-term descending trend line again, meeting the...

Oil prices are largely under pressure amid demand concerns, while the European gas market continues to sell off aggressively Energy – TTF Sell-Off Continues Oil prices continued...

Oh man, can President Trump’s leadership move markets. President Trump’s deal-making and negotiating skills are changing the hearts and minds of world leaders as he leaves his...
Are you sure you want to block %USER_NAME%?
By doing so, you and %USER_NAME% will not be able to see any of each other's Investing.com's posts.
%USER_NAME% was successfully added to your Block List
Since you’ve just unblocked this person, you must wait 48 hours before renewing the block.
I feel that this comment is:
Thank You!
Your report has been sent to our moderators for review


Add a Comment
We encourage you to use comments to engage with other users, share your perspective and ask questions of authors and each other. However, in order to maintain the high level of discourse we’ve all come to value and expect, please keep the following criteria in mind:
Enrich the conversation, don’t trash it.
Stay focused and on track. Only post material that’s relevant to the topic being discussed.
Be respectful. Even negative opinions can be framed positively and diplomatically. Avoid profanity, slander or personal attacks directed at an author or another user. Racism, sexism and other forms of discrimination will not be tolerated.
Perpetrators of spam or abuse will be deleted from the site and prohibited from future registration at Investing.com’s discretion.