The Elliott wave theory is a form of technical analysis that traders use to analyse the market and forecast the trend and we will explain how we use it for One Market Concept. The theory was developed by Ralph Nelson Elliott, around 1930. The theory is based on the idea that the Market advances in 5 waves and pullbacks in 3 waves. As we mentioned earlier, the theory was developed in the 1930s and most of the study was based on Indices and with only observation, Mr. Elliott did not have many tools or Instruments to use or to compare. Right now, we are in 2018 and the world has changed, also technology has come a long way. We at www.Elliottwave-forecast.com have noticed from years that the old theory is not enough and can be used but needs to be combined with other tools and ideas. We have worked constantly for many years to improve the theory and make it better. We are working to adapt to a more reliable and practical system.
One of the Ideas which we have developed is a concept of “One Market”. We will explain how it works and why it is needed to improve the accuracy of the forecast and hence the trading results. The Elliott wave theory is famous for always having more than one possible path and we see many traders following a principal path, then they have a series of alternative paths just in case the principal path doesn’t work. From experience, we have concluded it’s hard to trade this way, so we add many tools to a system in order to help The Elliott wave theory and remove the suggesting nature of the theory. The idea that each move can be seen in different ways is not reliable enough for you to place your money on one idea or side of the Market. The One Market concept follows as many instruments around the group and divides the instruments into groups and follow cycles and sequences for each instrument and groups and most of everything correlated them into a higher degree path, which always is more reliable than that following only The Elliott wave theory. We have been using this concept for a long time at www.Elliottwave-forecast.com and have been able to be in the right side most of the time and to forecast many big turns in the Market only base in the one market concept. The following example is showing the reality of current trading. We will be using the USD/ZAR and EUR/USD as an example, both pairs are USDX related and both the USDX and EUR/USD base in the simple Elliott wave theory can be labelled in 5 waves, if the wave is not following a dip system and only the Elliott wave theory as was developed in 1930. The following chart shows
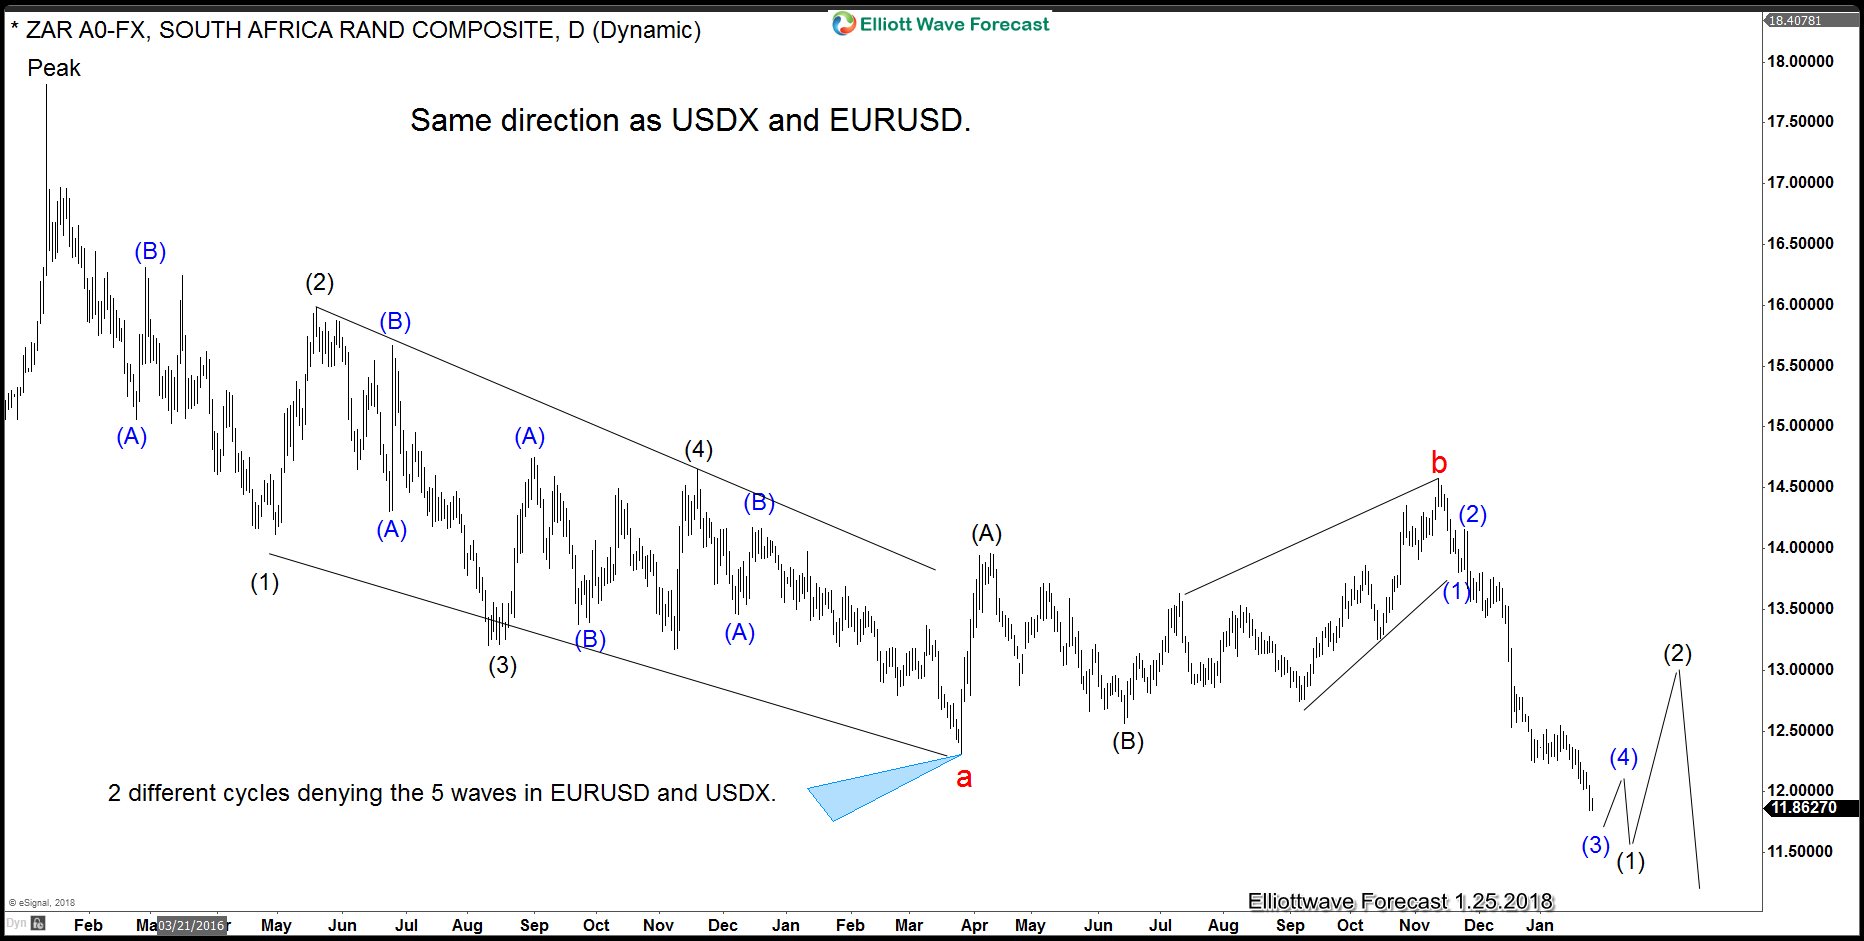
USD/ZAR Daily Chart Elliott Wave Analysis – One Market Concept
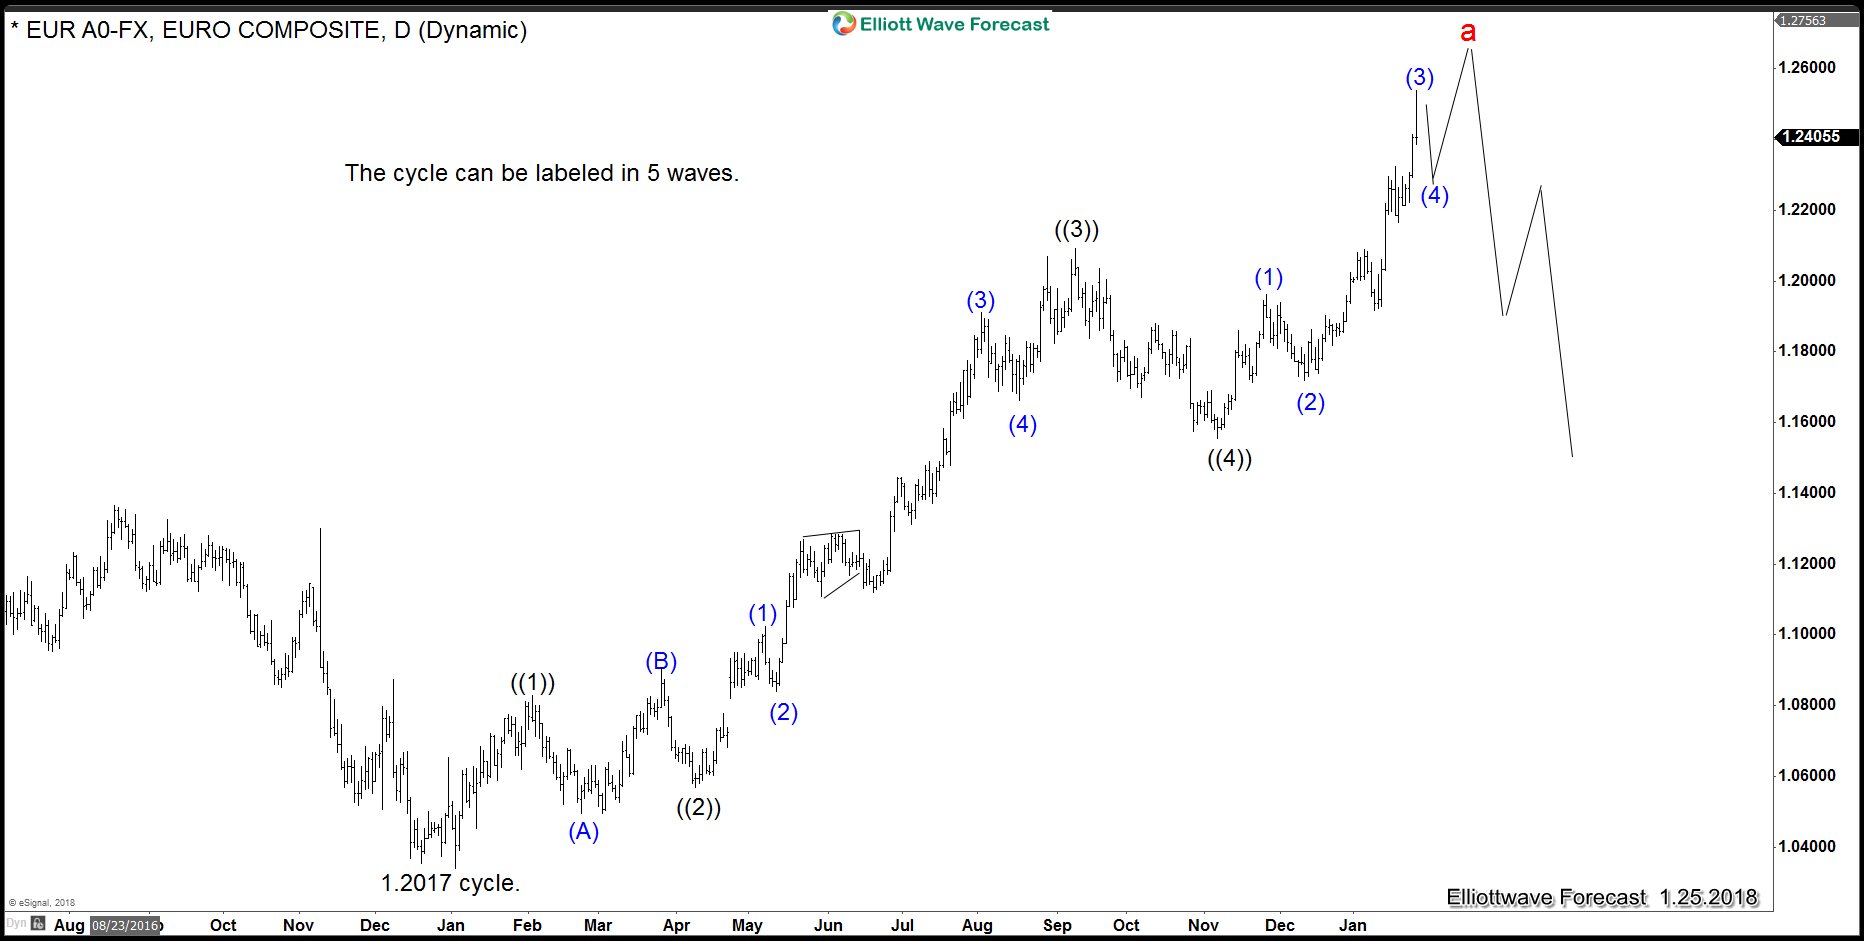
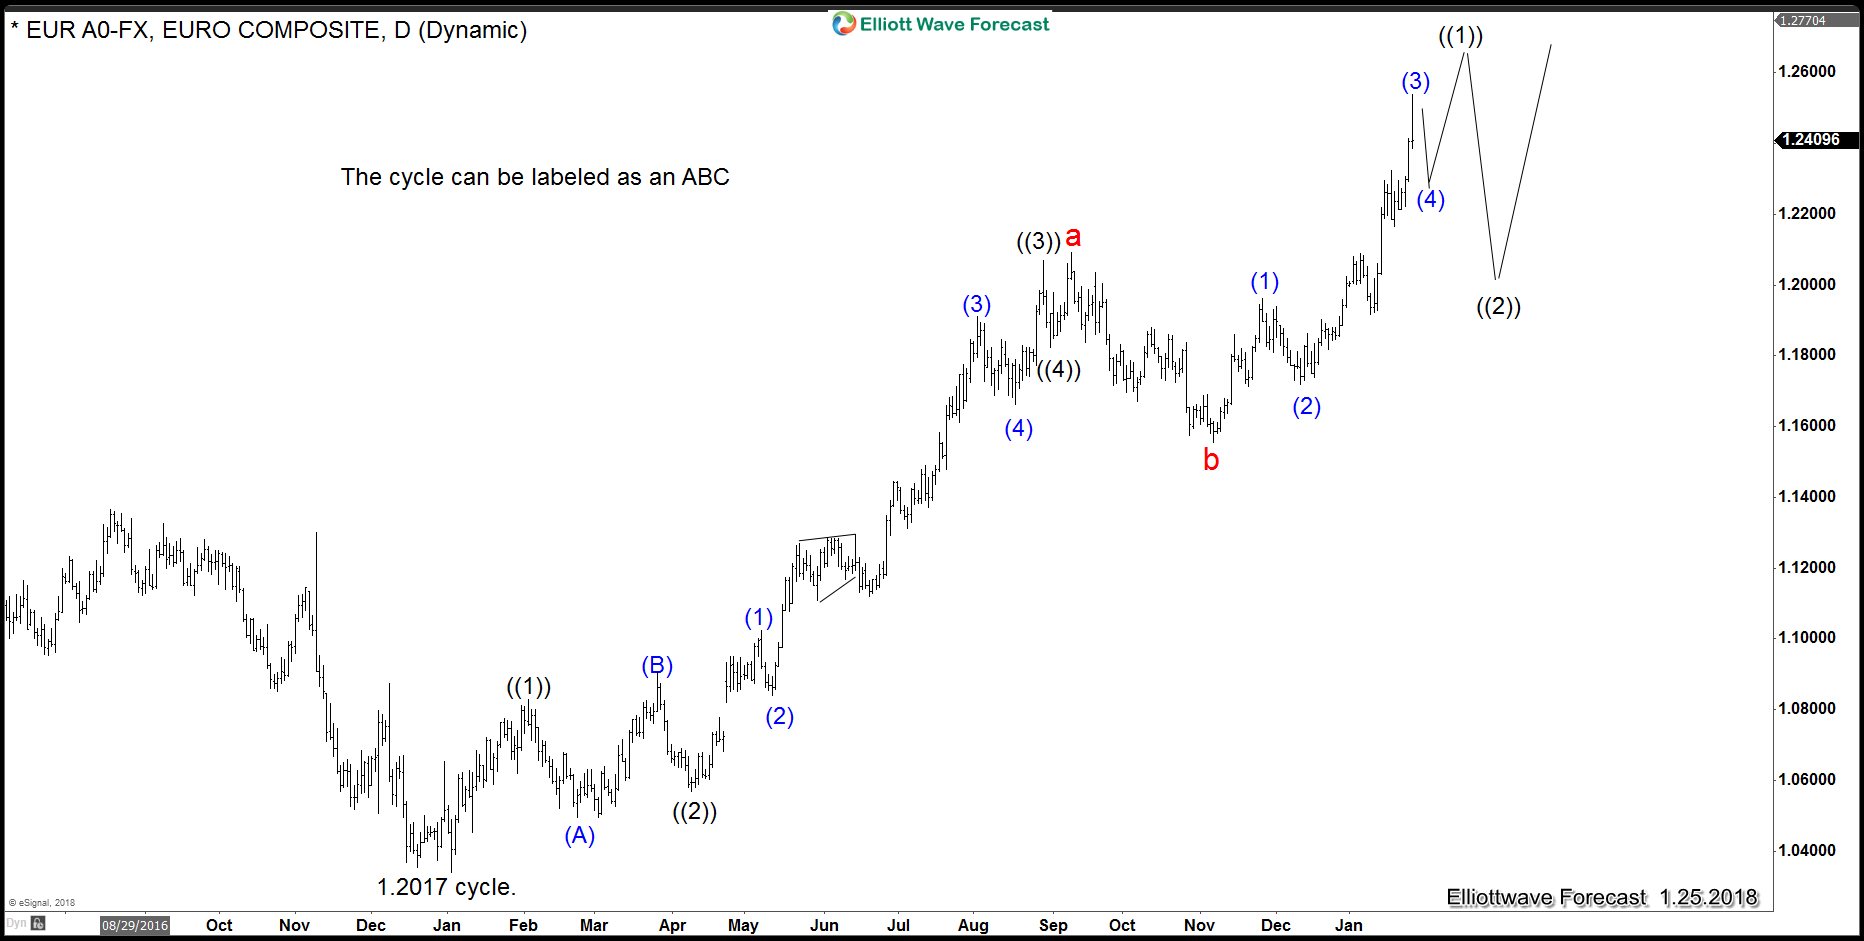
USD/ZAR which shows 2 different cycles and bearish sequences since the peak in 2016, the instrument cannot be labeled as an impulse and can only be labeled as either ABC from the peak or an impulse wave 3, which both are viewed as bearish the pair. The other is the EUR/USD from lows in 2016 have 2 paths, either a 5 waves advances and a huger declined or more upside into the 100% from lows in 2017, which should take it minimum at 1.32-1.4000 area.
EUR/USD 5 waves advances
EUR/USD ABC Elliott Wave Path
The 1930 Elliott wave theory will not tell you which path will be valid, but the One Market concept is giving the ABC path a much higher probability than the 5 waves. This is an example of how we use Elliott wave theory at www.Elliottwave-forecast.com which is different and most up to date than most traders, we are living in 2018 and using the tools which current times are providing to us.
