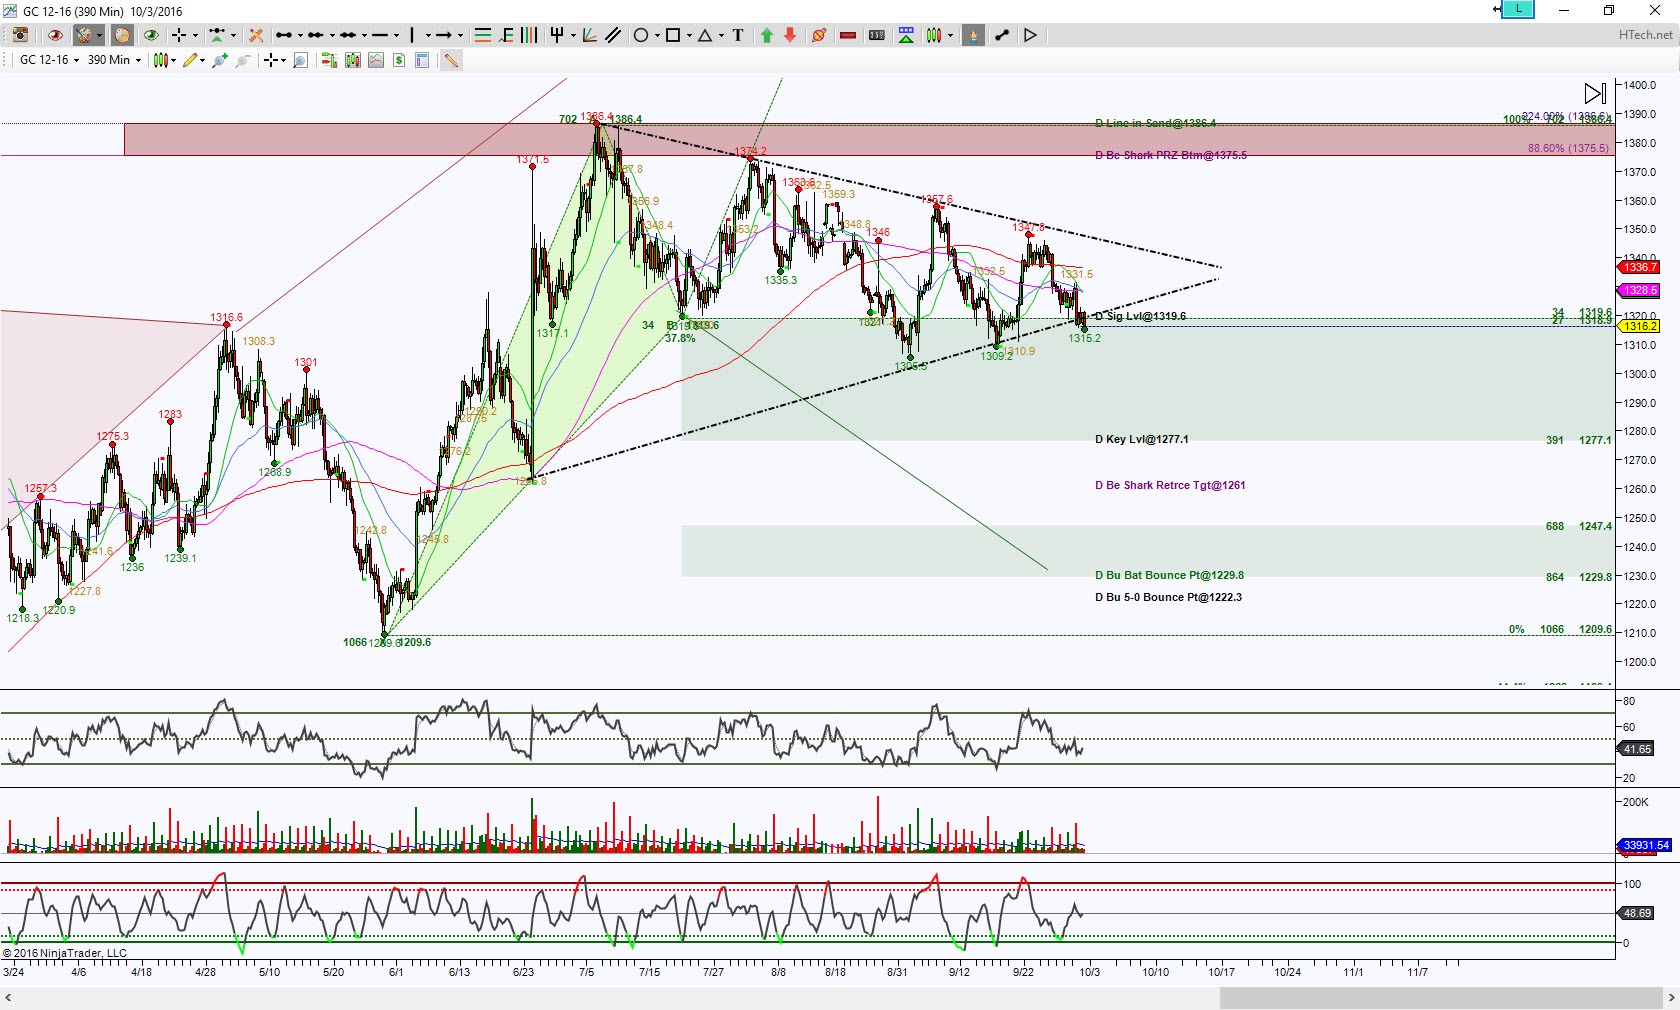
Gold futures Day chart shows price is testing some convergence support region of 1319.6 to 1318.9. If the bulls throw GC_F to trash, then implication is price is still attempting to retrace a completed harmonic pattern called Bearish Shark. It’s ideal minimum target is 1261 and ideal target is 1222.3, this correlates with another harmonic pattern, a Bullish Bat at 1229.8. Simply put, a hold below 1318.9 has an ideal target at a double PRZ (Potential Revesal Zone aka the completion target for harmonic patterns) at 1229.8 to 1222.3.

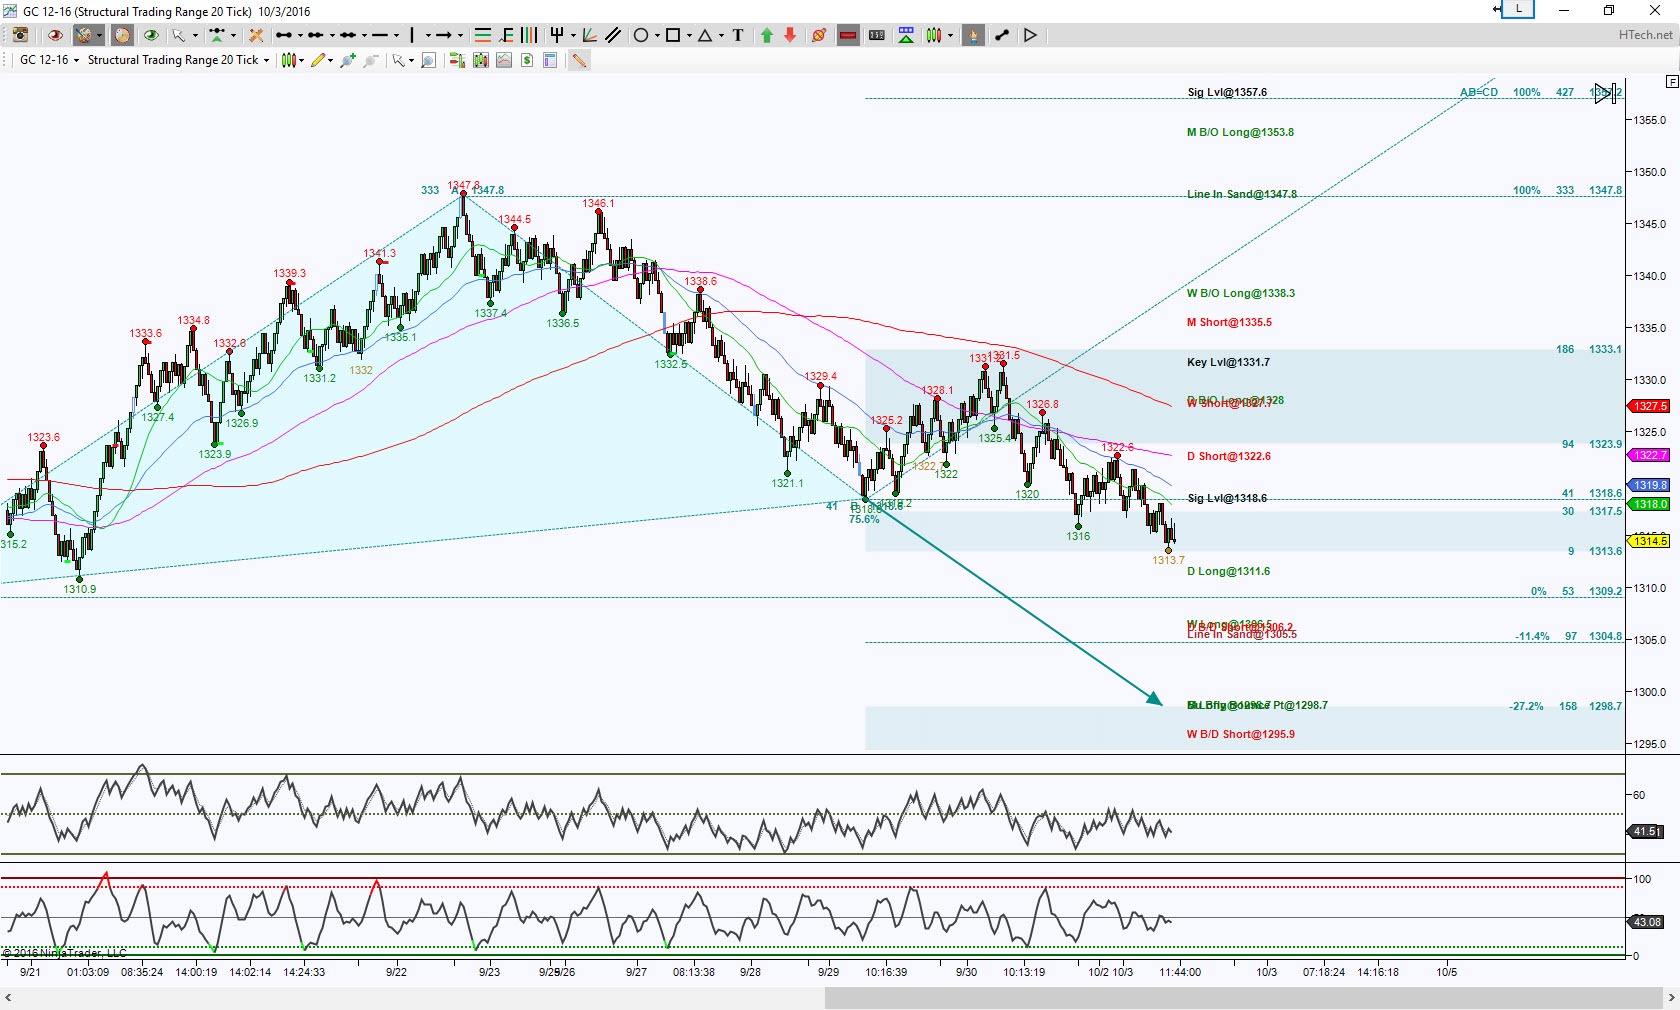
For an intraday perspective, I’m looking at an STRange 20 bar, this chart shows the initial levels to break and hold are above 1318.6 or below 1313.6 then 1311.6. An upside break risks shifting the intraday bias from down to neutral with an upside pull, increasing in upside pull above 1328 area.
A downside break of 1313.6 does have initial target at 1311.6, and some convergence at 1305 but ideally looking for a target of 1298.7 to complete the cyan colored harmonic pattern, called a Bullish Butterfly at 1298.7 with a potential breach to 1295.9.

If the intraday scenario of testing 1298.7 occurs, this will help the Day chart test the midpoint of the green zone (1318.9 to 1277.1), this zone is called a GRZ (Golden Ratio Zone aka the area between a 38.2% to 61.8% Fibonacci ratios). GRZ’s & PRZ’s are clues for initial directional bias when price can break outside of it with conviction. So keep an eye on what happens at that mipoint of the GRZ around the intraday Bullish Butterfly PRZ at 1298.7, it’s a place for bulls to defend. But as said, there’s a calling of price to that double PRZ at 1229 region so bulls will need conviction at this juncture to be able to push above 1318.9 and they just don’t have that yet.
Trading involves substantial risk and is not suitable for all investors. Past performance is not indicative of future results.
by Kathy Garber
