A few years ago I attended a seminar where Jake Bernstein spoke about seasonality. This really appealed to me because of the statistical nature of seasonality. You had your odds and could bet accordingly. From there I bought a few of Jake’s books and did a little more reading on the subject. I subscribed to his newsletter for a while and probed the internet for more information. I found that there are a lot of websites that provide great information on seasonality. What I discovered is that seasonality works! Except when it doesn’t.
The interesting thing about statistics is that they can be shaped, morphed and eventually strained into making you think there is something there when there really isn’t. An older but good book on the subject is How to Lie with Statistics by Darrell Huff. When I first read it back in the 90’s, it was quite illuminating. Since then, I have come to understand that the responsible use of statistics is a powerful tool and that the misuse of them is also a powerful tool. There is a temptation to read too much into market statistics just the same way that there is a temptation to read too much into technical indicators. Statistics and indicators (many based on statistics themselves) really fall into the category of “it is what it is”. Over-reaching interpretations won’t help you over the long run.
In a table shown below (from seasonalodds.com), we see that over the last 20 years, the S&P has finished positive in the month of September 55% of the time. That means that if you had taken a trade where you bought the S&P on the first day of September and you sold it on the last day of September, and you did this every year for the last 20 years, you would have won 11 times and lost 9 times. That’s a positive edge. At least that’s how it appears on the face of it. But also in that same chart, we see that the average return for September over those 20 years is -0.13%. This is because September, on average, is the worst month of the year to be long in the market (you can Google it as there are dozens of articles pointing this out – a recent one is here).
So even though there may be a positive edge, you must know what to do when that edge doesn’t play out. It’s no good jumping in on a statistical edge and then not jumping out should the market go against your position. If your wins are smaller than your losses, having more wins won’t help. And therein lies one of the flaws in seasonality. It gives you odds but it says nothing about trading style, position sizing or risk management all of which are critical components when working in the markets. That’s the funny thing about statistics, they doesn’t always tell the whole story.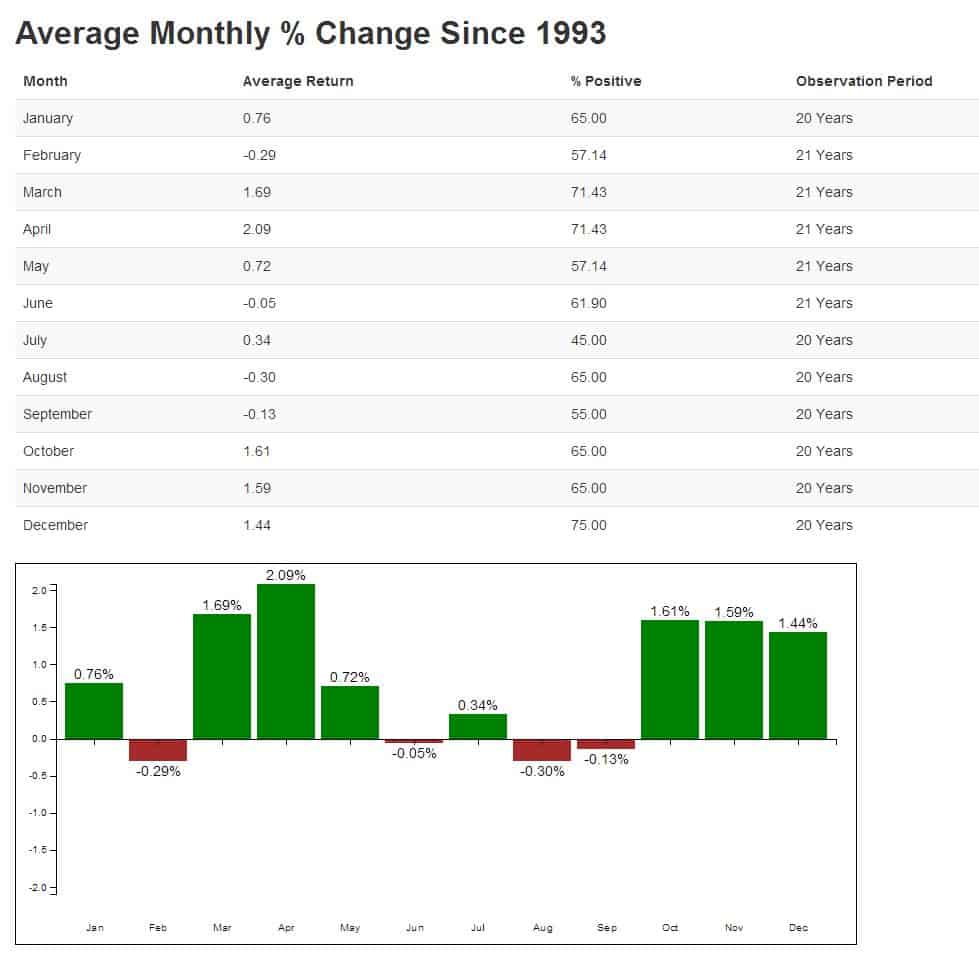
Shown below is a seasonal table for gold via the SPDR Gold Shares ETF (GLD) (from seasonalodds.com). This is a fantastic looking chart and suggests that you should be in gold starting now and stay there through November. But before you do, take a look at the data set. There are 8-9 years’ worth of data. Is that sufficient? Almost certainly not. The reason is that the data set covers a period predominated by a historic bull run in gold. There is no doubt that in the previous 8 years or so, being long gold in July through November was the right move.
But buying gold just about any time since 2001 has been the right move. Such is the nature of bull markets. They are a great time to buy except for the time after the peak. For the months of August and September there is a 75% chance that gold will finish higher at the end of those months than where it was at the beginning. We won’t know if this August and September become part of the 75% group or the 25% group. If you are betting on 75%, just make sure you know what to do should it turn out to be one of those times where gold's price lands in the 25% group.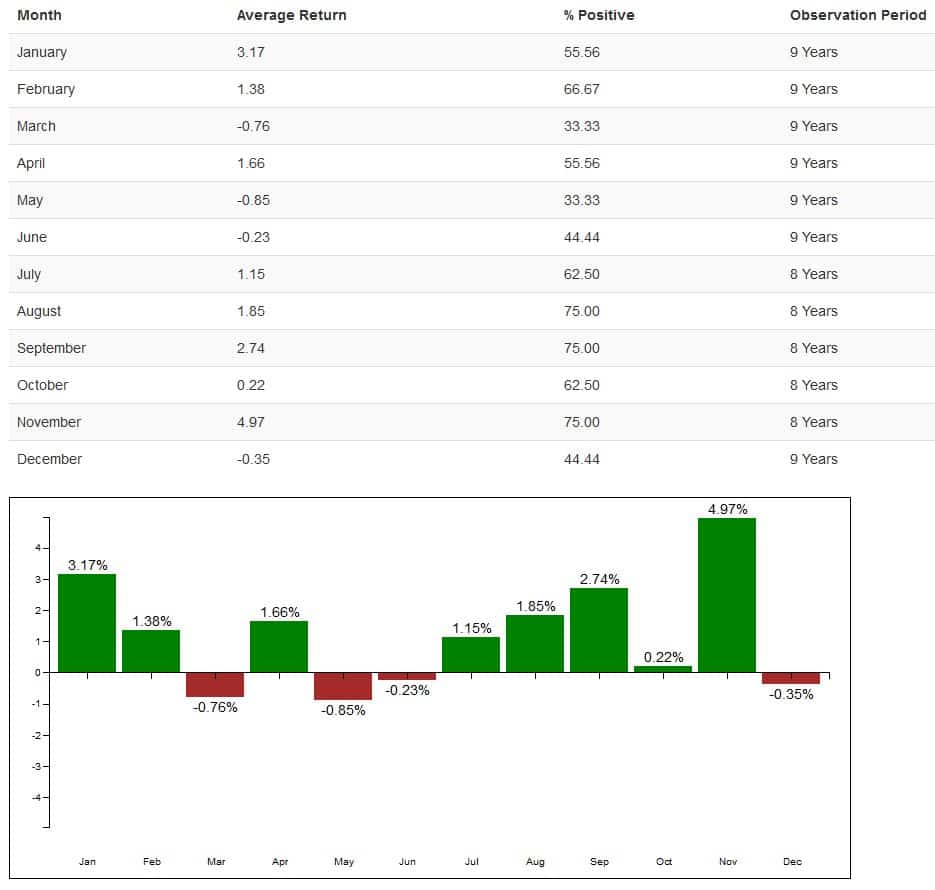
I have to admit that I have been unfair in the previous seasonal chart of the GLD ETF. It has only been around for 9 years of which the majority of time, gold has been in a spectacular bull phase (presently it is not according to my monthly and weekly charts). I did this to point out that statistics are sometimes based on too little data. We do have seasonality data on gold itself, for the last 30 years. As you can see in the chart below, the last half of the year has been a good time to be long gold.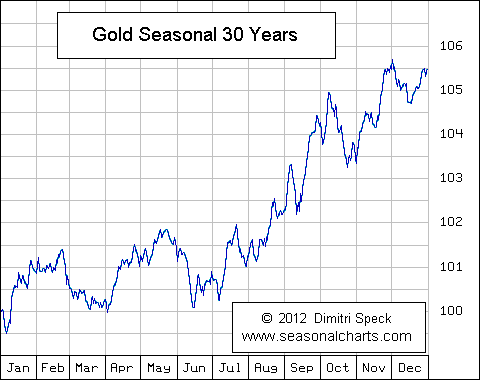
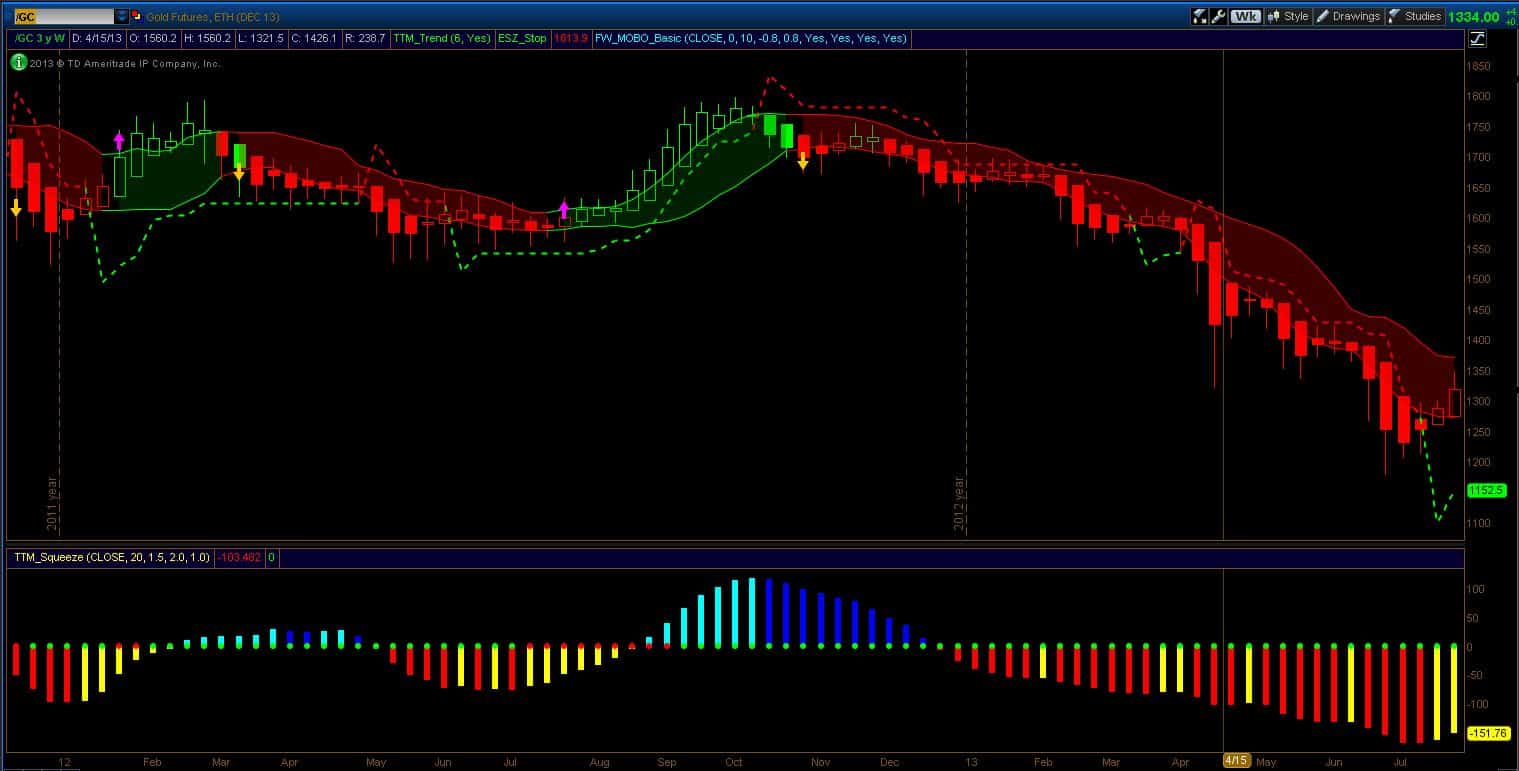
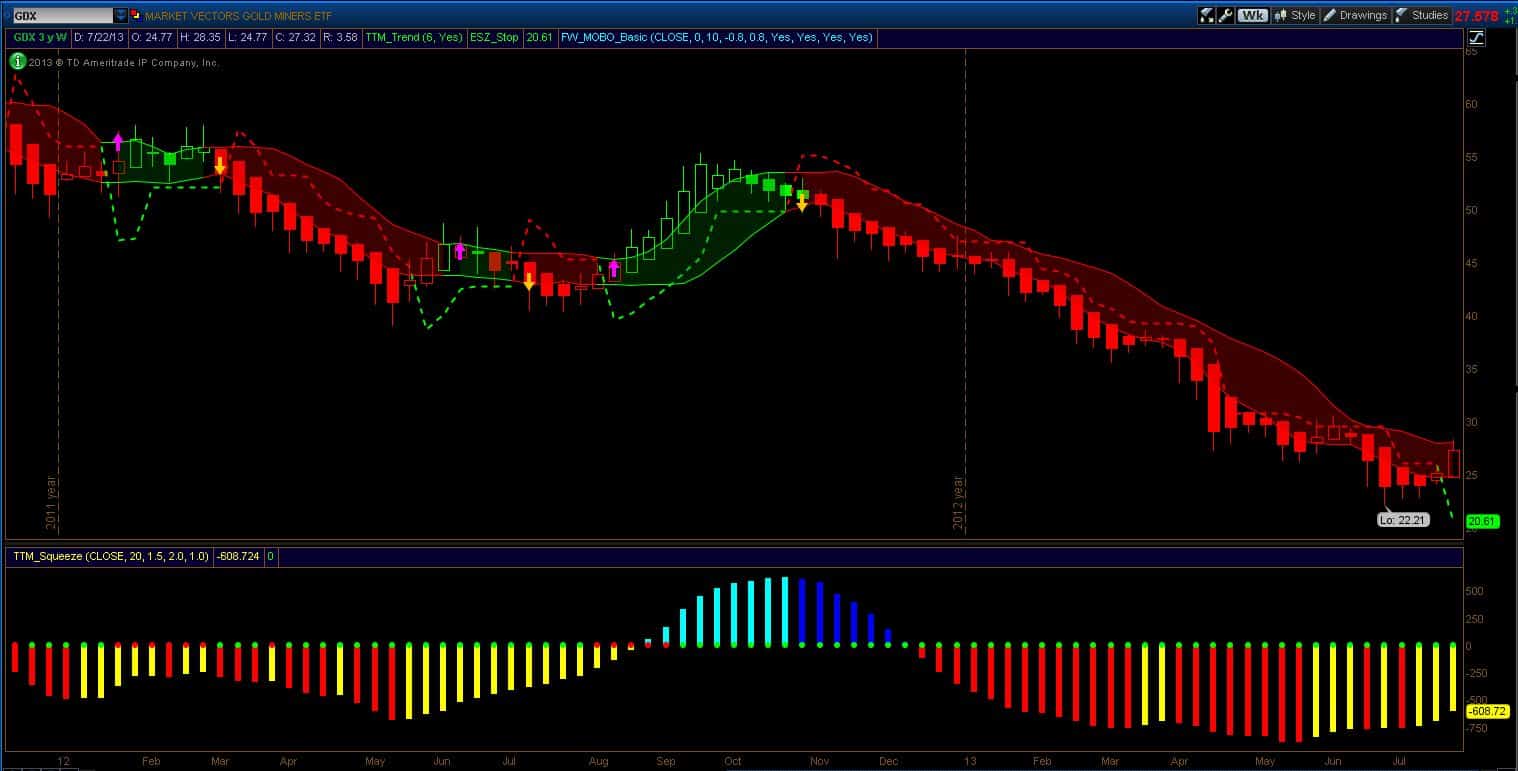
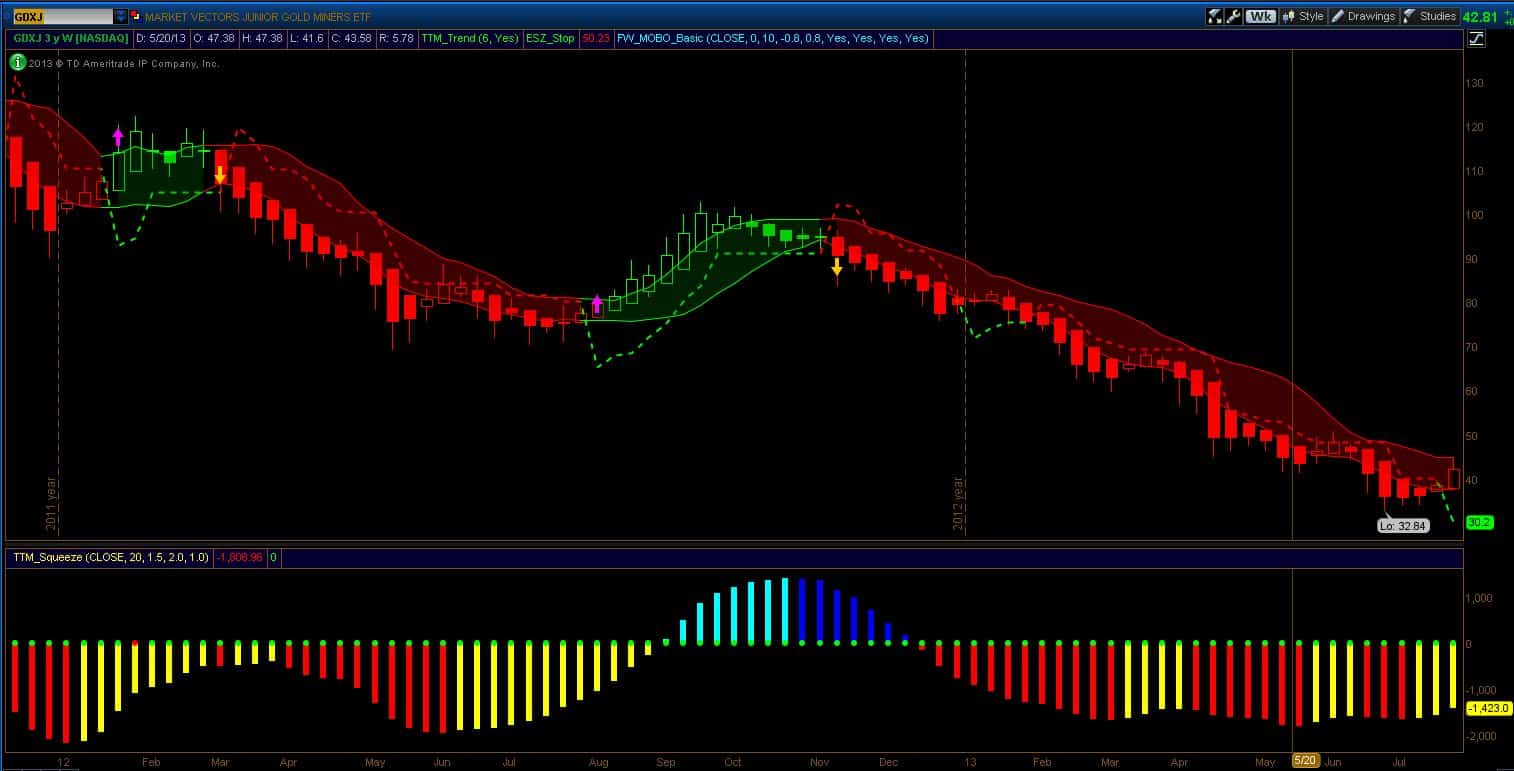
My usual charts are below and there is not much to say. The SPX is in bull mode and Gold is not. However, as I stated last week, I suspected that the Market Vectors Gold Miners ETF (GDX) and the Market Vectors Junior Gold Miners ETF (GDXJ) would both trigger the short stop (meaning if you were short, it was time to close that position). That is exactly what happened.
I am now waiting to see if I get a long signal. Certainly seasonality is in favor of this happening but seasonality only works with multiple samples over a long period of time. At any given moment, month or year, seasonality can be wrong since no indicator or method is a perfect forecaster.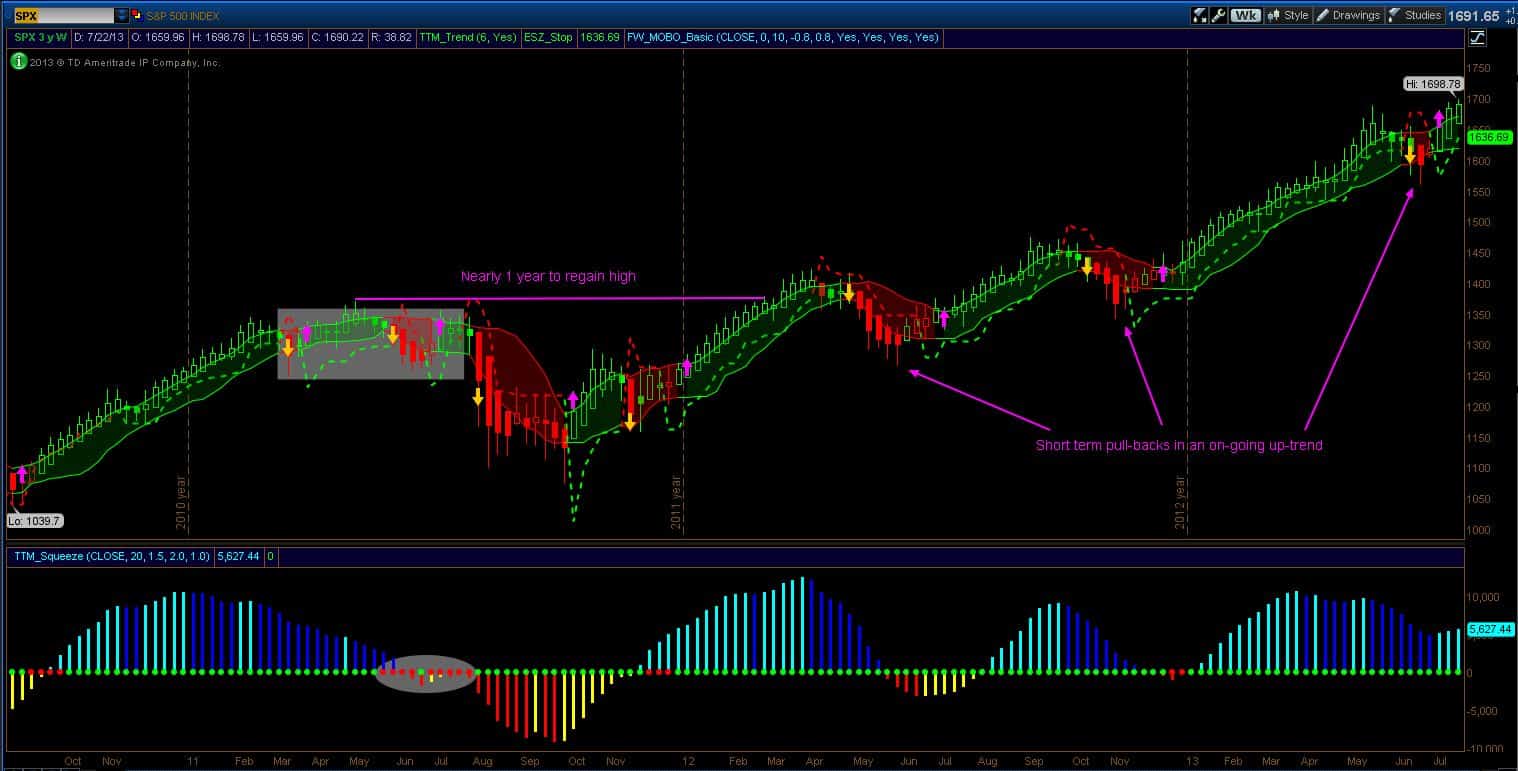
Finally, in my last post, I suggested that there may be business reasons that explain some of the conspiratorial ideas surrounding gold and storage. Specifically I said about JP Morgan (JPM) that:
“They might be reducing inventory in preparation for new inventory from another customer, they may be moving it to a partner holder, or they might be getting out of the business of storage.” Several days later in a late Friday afternoon news release, CNBC ran this story.
The opening sentence says a lot: “JPMorgan is exiting physical commodities trading, the bank said in a surprise statement on Friday”. The article also states that “The firm will explore “a sale, spinoff or strategic partnership” of the physical business”. So like any business that is getting out of carrying a specific item, they are reducing inventories and looking at strategic alternatives. The how and why of which we will not know until much later. That information is proprietary to JPM business operations.
- English (UK)
- English (India)
- English (Canada)
- English (Australia)
- English (South Africa)
- English (Philippines)
- English (Nigeria)
- Deutsch
- Español (España)
- Español (México)
- Français
- Italiano
- Nederlands
- Português (Portugal)
- Polski
- Português (Brasil)
- Русский
- Türkçe
- العربية
- Ελληνικά
- Svenska
- Suomi
- עברית
- 日本語
- 한국어
- 简体中文
- 繁體中文
- Bahasa Indonesia
- Bahasa Melayu
- ไทย
- Tiếng Việt
- हिंदी
On Gold And Seasonality: Is Now A Good Time To Buy?
Published 07/30/2013, 12:22 AM
Updated 07/09/2023, 06:31 AM
On Gold And Seasonality: Is Now A Good Time To Buy?
Latest comments
Loading next article…
Install Our App
Risk Disclosure: Trading in financial instruments and/or cryptocurrencies involves high risks including the risk of losing some, or all, of your investment amount, and may not be suitable for all investors. Prices of cryptocurrencies are extremely volatile and may be affected by external factors such as financial, regulatory or political events. Trading on margin increases the financial risks.
Before deciding to trade in financial instrument or cryptocurrencies you should be fully informed of the risks and costs associated with trading the financial markets, carefully consider your investment objectives, level of experience, and risk appetite, and seek professional advice where needed.
Fusion Media would like to remind you that the data contained in this website is not necessarily real-time nor accurate. The data and prices on the website are not necessarily provided by any market or exchange, but may be provided by market makers, and so prices may not be accurate and may differ from the actual price at any given market, meaning prices are indicative and not appropriate for trading purposes. Fusion Media and any provider of the data contained in this website will not accept liability for any loss or damage as a result of your trading, or your reliance on the information contained within this website.
It is prohibited to use, store, reproduce, display, modify, transmit or distribute the data contained in this website without the explicit prior written permission of Fusion Media and/or the data provider. All intellectual property rights are reserved by the providers and/or the exchange providing the data contained in this website.
Fusion Media may be compensated by the advertisers that appear on the website, based on your interaction with the advertisements or advertisers.
© 2007-2025 - Fusion Media Limited. All Rights Reserved.
