The emerging markets had a solid July 2020, up roughly 7% depending on the proxy you use. The rapid slide in the US dollar has also helped.
At present, the emerging market asset class represents a “value” or non-momentum offset to our large-cap tech and growth concentration, which is a substantial part of the S&P 500’s return the last 5 years.
In fact, to hold emerging markets has cost accounts dearly, but it’s a necessary complement to what is unfolding now.
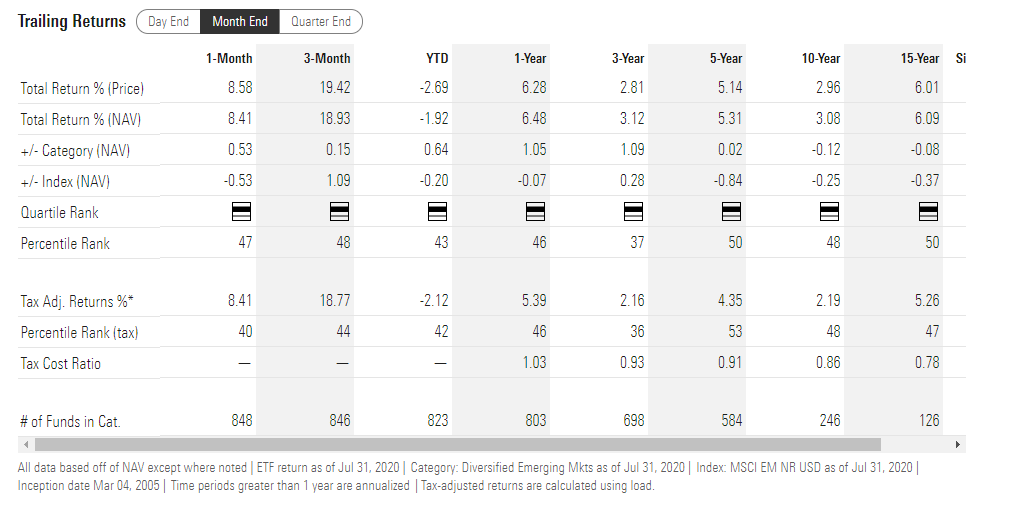
Reading our previous posts on the subject, it was in Q1 ’16 where the iShares MSCI Emerging Markets ETF (NYSE:EEM) and Vanguard FTSE Emerging Markets Index Fund ETF Shares (NYSE:VWO) had their first 10-year negative return in, well, years. That was our initial investment, but it was small 2% – 3% of accounts, but the ETF’s returned 35% – 40% that year. We added more in 2018, and last year, and still today we are taking bite-sized increments of the VWO and Oakmark International Fund Investor Class, although OAKIX is really a developed non-US market play.
Here is why I continue to like the asset class and VWO:
VWO historical return data:

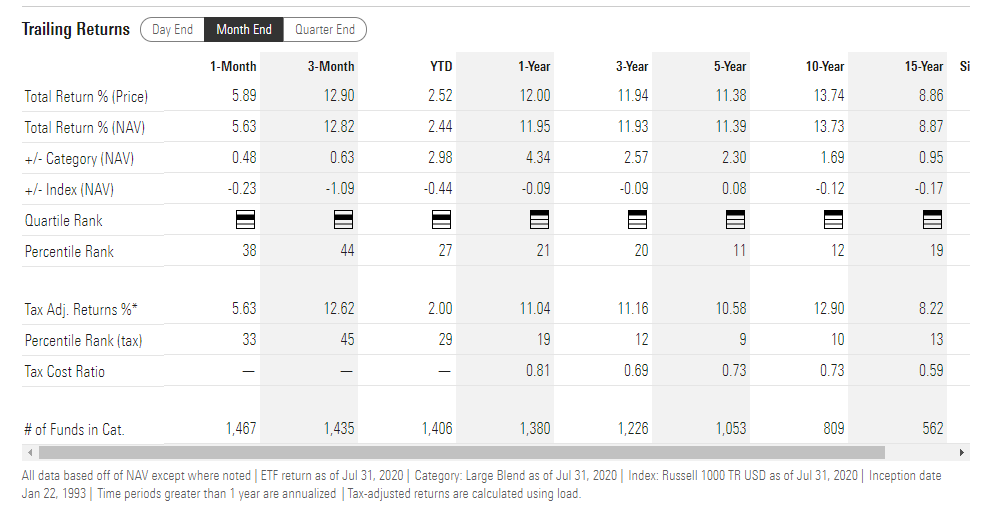
SPY historical return data:

The key metric is the 10-year “average, annual” return for the SPDR S&P 500 (NYSE:SPY) versus the VWO or the 13% vs 3% return differential.
Emerging markets are out-of-favor as reflected by poor sentiment, and COVID-19 has dealt the asset class a severe blow given that many of these countries do not have the quality health care systems that the US and other developed countries have. VWO and OAKIX represent uncorrelated holdings for the growth positions.
What About Oakmark International?

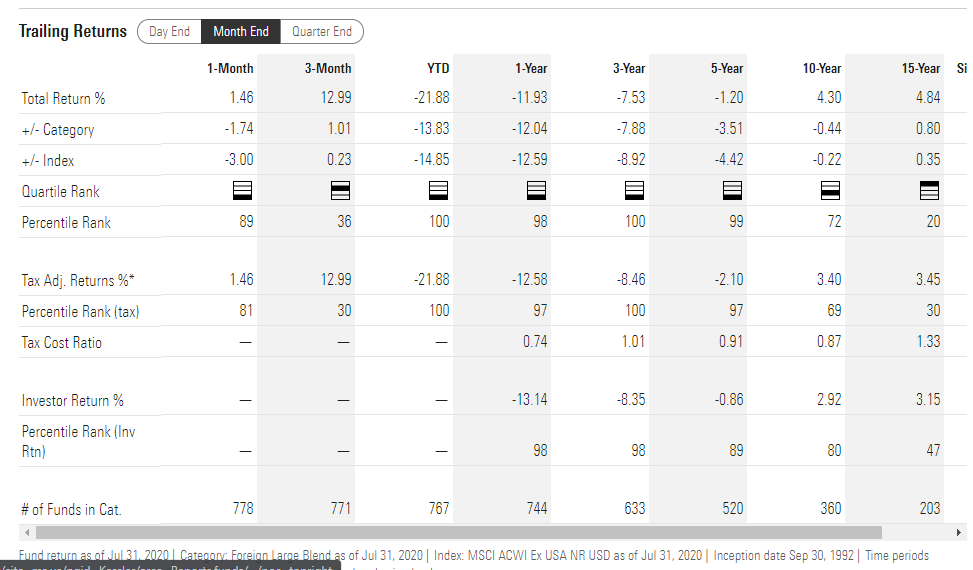
As of the end of July 2020, the Oakmark International was still down 21% and the fund’s percentile rank remains at the wrong end of the extreme. However, David Herro, Morningstar’s Portfolio Manager from 2000 to 2010, believes much of this is related to China and their annual GDP growth of 15% per year right up until 2008 – 2009. From the perspective of a value investor, new buys of the fund here are likely to have less downside – and with patience – more upside, than any time in the last 20 years.
Since the March 23rd lows in the S&P 500, the emerging and international markets have improved, with the weaker dollar helping in the last few months.
Conclusion
The dollar has bounced sharply the last few days after hitting the lower-end of long trading ranges. Although the greenback is currently trading in red, even if it stabilizes, the weakening USD over the last few months should continue to help the emerging market asset class.
The continued dramatic out-performance of the top 5 companies within the S&P 500 is likely to keep some allocations away from emerging markets given the performance differential, but if you consider how quickly a rotation in asset classes can come, it may be worth considering emerging markets.
