Omnicare, Inc. (OCR) is a healthcare services company. The Company operates in two primary businesses: Long-Term Care Group (LTC) and Specialty Care Group (SCG).
I found this stock using a real-time custom scan. This one hunts for calendar spreads between the front two monthly expiries.
Custom Scan Details
Stock Price GTE $5
Sigma1 - Sigma2 > 7
IV30™ GTE 30
Average Option Volume GTE 1,200
The goal with this scan is to identify back months that are cheaper than the front by at least 10 vol points. I'm also looking for a reasonable amount of liquidity in the options (thus the minimum average option volume) and enough strikes to spread and thus a minimum stock price. I also require a minimum vol level in order to avoid any boring ETFs (or whatever).
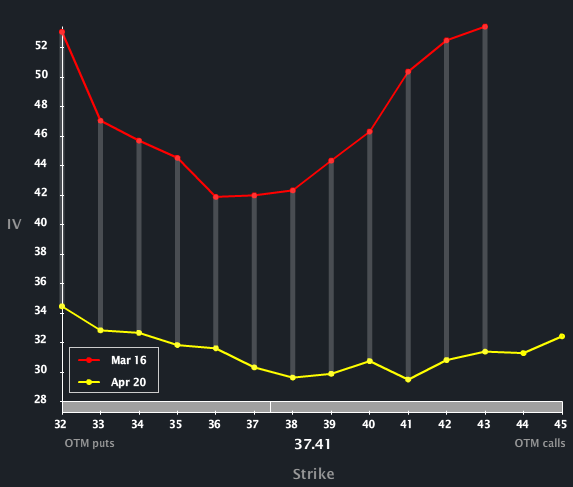
Let’s start with the Skew Tab to examine the month-to-month and line-by-line vols.

We can see how elevated the front is to the back and how the front has a more parabolic skew. In English, the option market reflects greater risk in Mar than Apr overall, but specifically even greater risk to the tails (both sides).
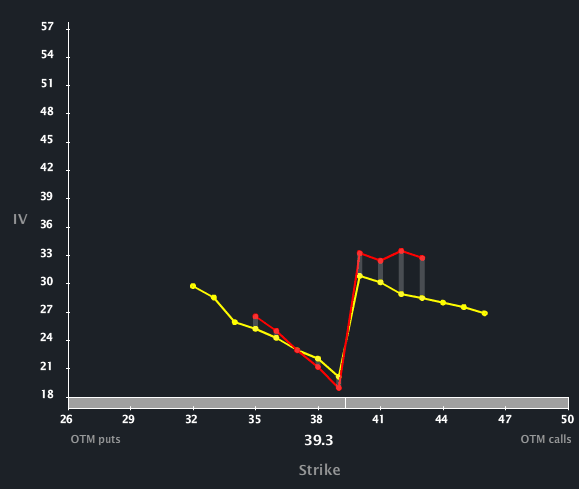
The elevated front vol is not due to earnings as the firm last reported on 2-19-2013. In fact, if we look back on that day on the Skew Tab, after the earnings report was released, we can see that the skews laid right on top of each other. I have included the OCR skew from 2-19-2013, below.

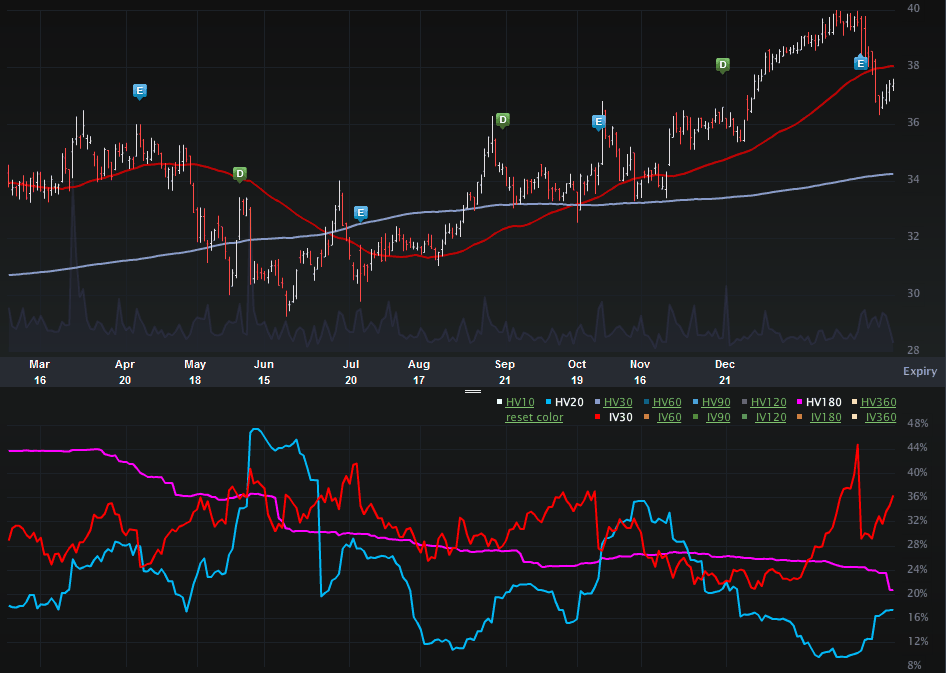
So, again, this vol diff that has opened up well after the fact from earnings, making it quite compelling. Let’s turn to the one-year Charts Tab (below). The top portion is the stock price the bottom is the vol (IV30™ - red vs HV20™ - blue vs HV180™ - pink).

On the stock side we can see a reasonable Y-O-Y return with the stock going from $33.91 to now ~$37.50. What is more noteworthy is the climb from $29 in early Jun to $40 in Feb. Then we see a significant dip in equity price after earnings and then just recently (the last four sessions) a small recovery.
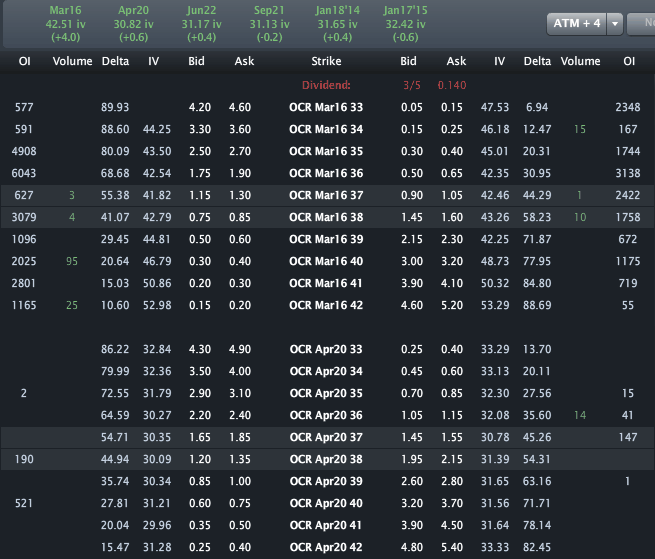
Finally, let's look to the Options Tab (below).

Across the top we can see Mar vol is priced to 42.51% and Apr is priced to 30.82%. It’s that vol diff that has triggered the scan. Given the recent move down off of earnings and then small rise of late and the complete reversal in the skew levels, this is a very compelling skew opportunity. One worth watching, IMHO.
Disclosure: This is trade analysis, not a recommendation.
Images provided by Livevol®
I found this stock using a real-time custom scan. This one hunts for calendar spreads between the front two monthly expiries.
Custom Scan Details
Stock Price GTE $5
Sigma1 - Sigma2 > 7
IV30™ GTE 30
Average Option Volume GTE 1,200
The goal with this scan is to identify back months that are cheaper than the front by at least 10 vol points. I'm also looking for a reasonable amount of liquidity in the options (thus the minimum average option volume) and enough strikes to spread and thus a minimum stock price. I also require a minimum vol level in order to avoid any boring ETFs (or whatever).
Let’s start with the Skew Tab to examine the month-to-month and line-by-line vols.

We can see how elevated the front is to the back and how the front has a more parabolic skew. In English, the option market reflects greater risk in Mar than Apr overall, but specifically even greater risk to the tails (both sides).
The elevated front vol is not due to earnings as the firm last reported on 2-19-2013. In fact, if we look back on that day on the Skew Tab, after the earnings report was released, we can see that the skews laid right on top of each other. I have included the OCR skew from 2-19-2013, below.

So, again, this vol diff that has opened up well after the fact from earnings, making it quite compelling. Let’s turn to the one-year Charts Tab (below). The top portion is the stock price the bottom is the vol (IV30™ - red vs HV20™ - blue vs HV180™ - pink).

On the stock side we can see a reasonable Y-O-Y return with the stock going from $33.91 to now ~$37.50. What is more noteworthy is the climb from $29 in early Jun to $40 in Feb. Then we see a significant dip in equity price after earnings and then just recently (the last four sessions) a small recovery.
Finally, let's look to the Options Tab (below).

Across the top we can see Mar vol is priced to 42.51% and Apr is priced to 30.82%. It’s that vol diff that has triggered the scan. Given the recent move down off of earnings and then small rise of late and the complete reversal in the skew levels, this is a very compelling skew opportunity. One worth watching, IMHO.
Disclosure: This is trade analysis, not a recommendation.
Images provided by Livevol®
