Selloff or Market Correction? Either Way, Here's What to Do NextSee Overvalued Stocks

Oil Victim Of A Bearish Channel And Wider Sentiment

Published 07/23/2015, 02:28 AM
Updated 05/14/2017, 06:45 AM
CL
-

Oil has been trending lower as a bearish channel dominates proceedings. That is unlikely to change and the bearish sentiment sweeping commodity markets is only confounding things.
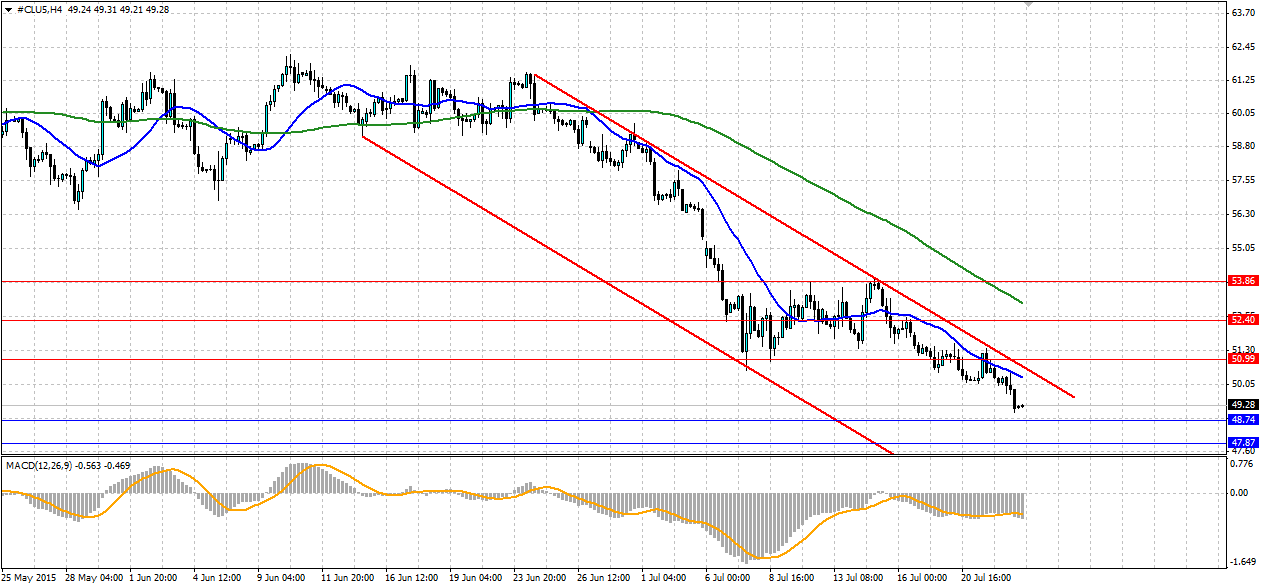
Oil 4-Hour Chart

Source: Blackwell Trader

The glut of oversupply in the oil market has seen crude light swing back into a bearish channel that has taken the commodity back below the psychological $50 mark. The economic troubles in Europe and especially China have seen demand for oil tail off which is a worrying sign for oil producers. Further adding to the bearish pressure was the news that sanctions will be lifted on Iran which will open up its oil fields for investment, adding to supply. The outlook is bleak for oil unless we see a large number of producers drop out, or economic activity pick up in China. But in the short term, that is unlikely.

The channel has been tested several times on its way down to the current levels. Each time the bears have defended it strongly which shows the momentum behind this bearish run. The MACD indicator also shows the momentum with it remaining below zero for pretty much the entire length of the channel.

The angle of the 100 H4 SMA (Green line) also shows the momentum of the bearish movement, with the 20 SMA maintaining a fair distance away from it. The 20 SMA is also likely to act as another line of resistance along with the channel itself.

Oil will target an area of liquidity that is not far below the current price. The $48.74 handle has acted as a swing point for oil several times earlier this year, so we could see some increase volatility as the bulls draw a line in the sand. If this fails, as the momentum suggests it will, look for further support at 47.87 and 46.38. If we do see a shift in momentum, look for resistance to be found at $50.99, 52.40 and 53.86 further up. As above, watch for dynamic resistance along the channel and the two moving averages.

Latest comments

Loading next article…
Risk Disclosure: Trading in financial instruments and/or cryptocurrencies involves high risks including the risk of losing some, or all, of your investment amount, and may not be suitable for all investors. Prices of cryptocurrencies are extremely volatile and may be affected by external factors such as financial, regulatory or political events. Trading on margin increases the financial risks.
Before deciding to trade in financial instrument or cryptocurrencies you should be fully informed of the risks and costs associated with trading the financial markets, carefully consider your investment objectives, level of experience, and risk appetite, and seek professional advice where needed.
Fusion Media would like to remind you that the data contained in this website is not necessarily real-time nor accurate. The data and prices on the website are not necessarily provided by any market or exchange, but may be provided by market makers, and so prices may not be accurate and may differ from the actual price at any given market, meaning prices are indicative and not appropriate for trading purposes. Fusion Media and any provider of the data contained in this website will not accept liability for any loss or damage as a result of your trading, or your reliance on the information contained within this website.
It is prohibited to use, store, reproduce, display, modify, transmit or distribute the data contained in this website without the explicit prior written permission of Fusion Media and/or the data provider. All intellectual property rights are reserved by the providers and/or the exchange providing the data contained in this website.
Fusion Media may be compensated by the advertisers that appear on the website, based on your interaction with the advertisements or advertisers.
© 2007-2024 - Fusion Media Limited. All Rights Reserved.