If you’re a bull or a bear in the oil market things have certainly ramped up after steady falls over the previous year. The question is are we in for a prolonged bull run like we have seen in the past when oil rebounds.
Source: Blackwell Trader (Oil, W1)
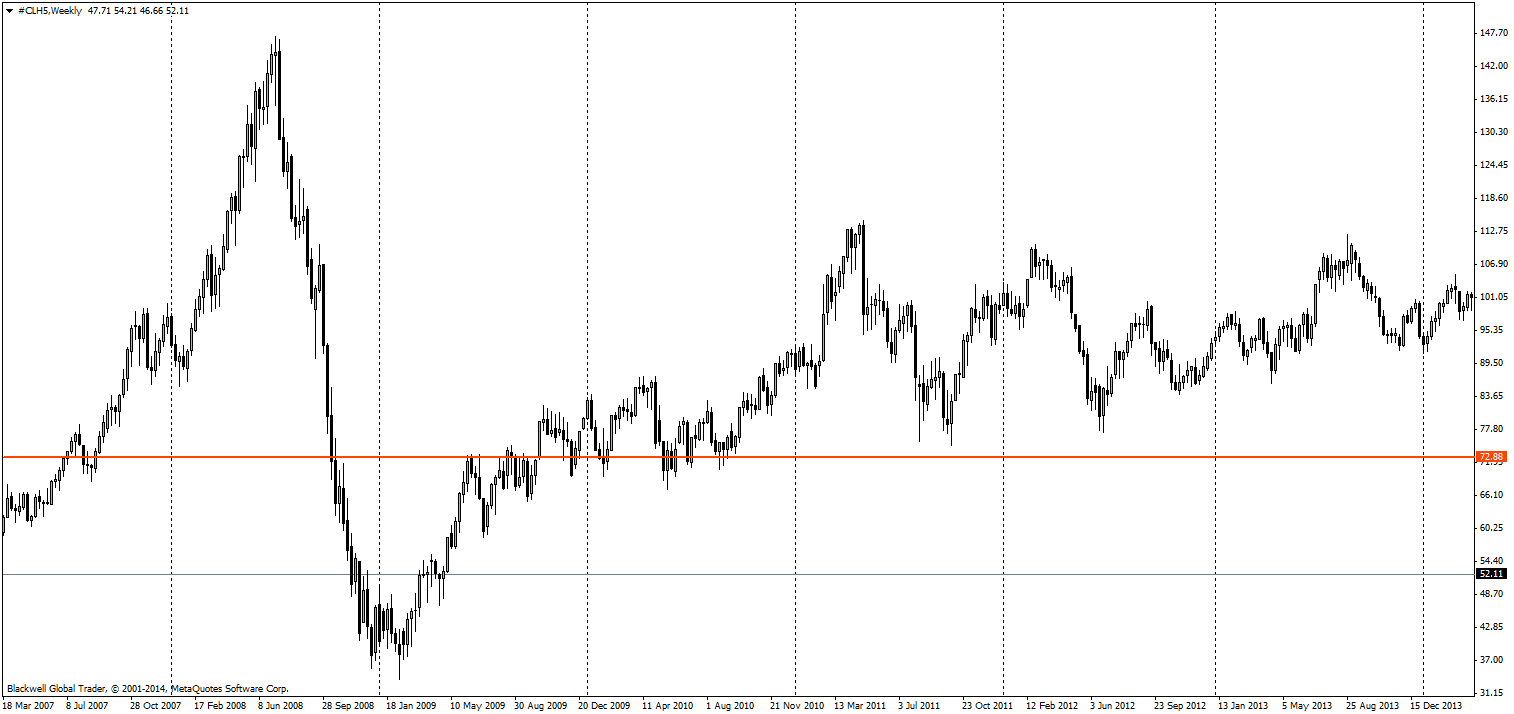
Previous rapid downward movements have been met by strong rallys: case and point 2009 on the chart above, which saw oil go from 38 dollars a barrel to 72 dollars a barrel. Many in the market expect this to happen again and it’s certainly possible we could see strong bullish movements in oil to continue in the week coming.
Source: Bloomberg (China oil imports)
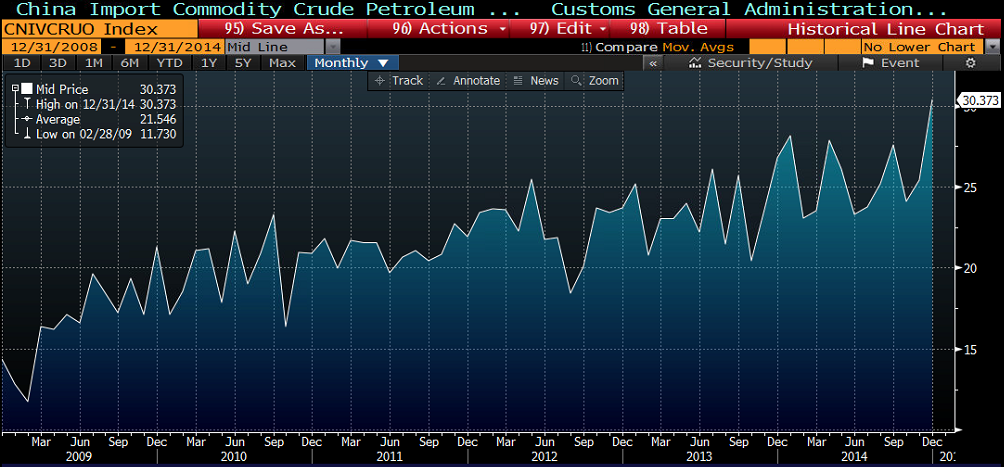
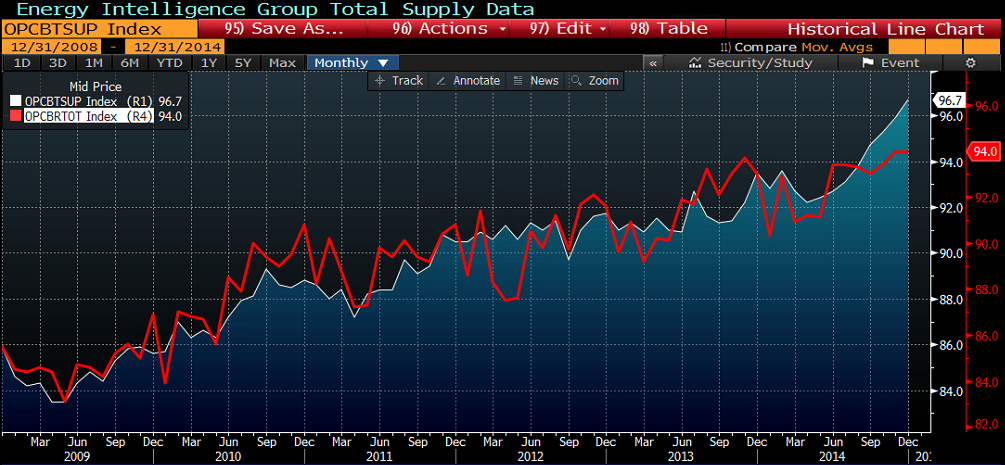
Many have been saying for some time there is still demand in the market and there certainly is. If you take a look at China, their demand for oil has been growing as expected over the recent years. But global demand is the big issues here as can be seen from the graph below.
Source: Bloomberg (Global Supply [white] vs Global Demand [red])
Global supply is exceeding demand by a significant amount in the marketplace. As can be seen on the chart we have had strong demand moving in line with supply for some time in the market place. The problem is that growth in demand has been slacking in Europe and even in the US, while supply growth has been very aggressive over the short term in the USA where shale has led an oil revolution.
However, recent strikes and lack of investment in further oil production has led to a sharp rally in the price of oil, and many are looking at this as the turning point, and it could very well be.
Source: Blackwell Trader (Oil, H1)
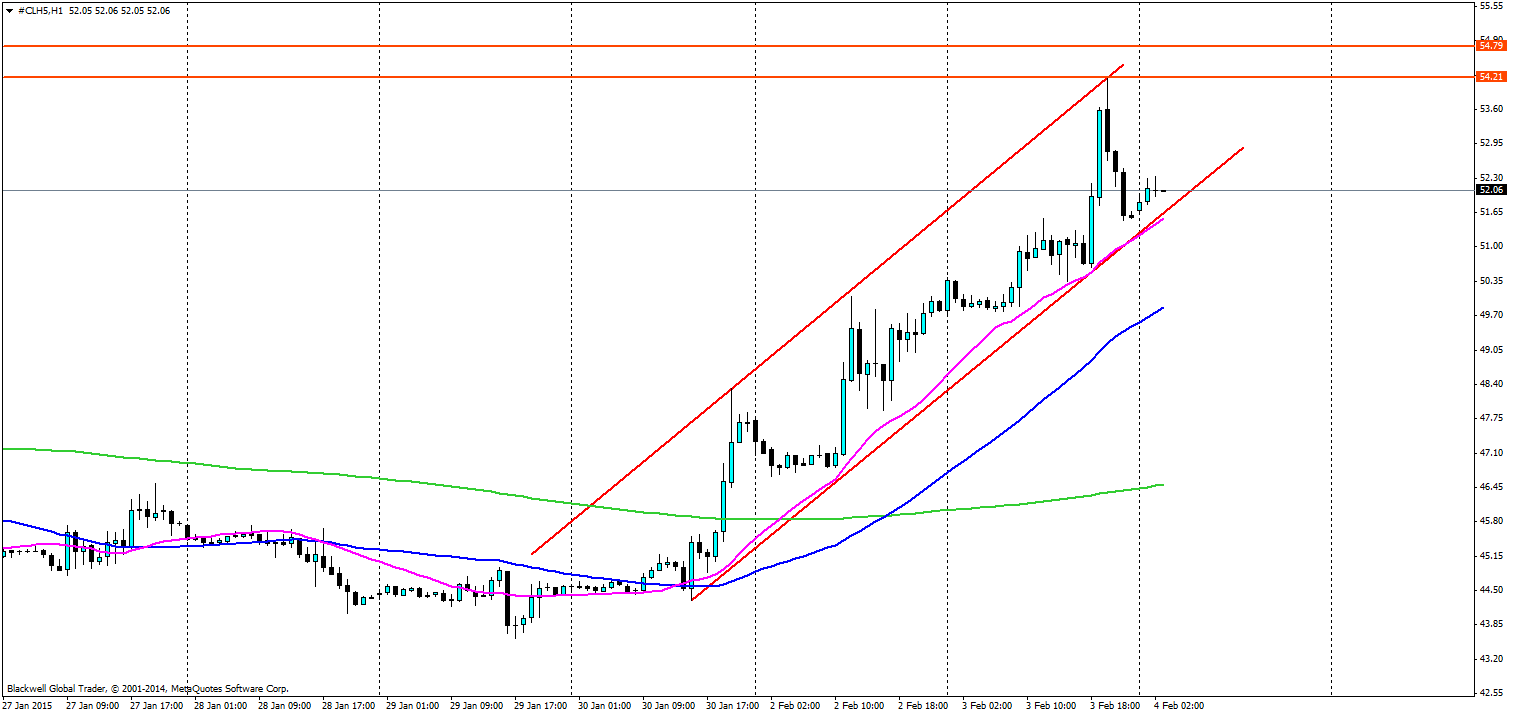
A quick look at the H1 shows a great bullish trend moving up the chart; a strong channel supported by the 20 SMA on all pullbacks lower. Higher highs are being pushed back when exceeding the top line as the market is still feeling the pinch.
Levels that are looking good for the market are 54.21 which will likely see a retest, and if we see a breakthrough of that then 54.79 is certainly on the cards. Any higher extension will be aiming for 58.96 on the charts.
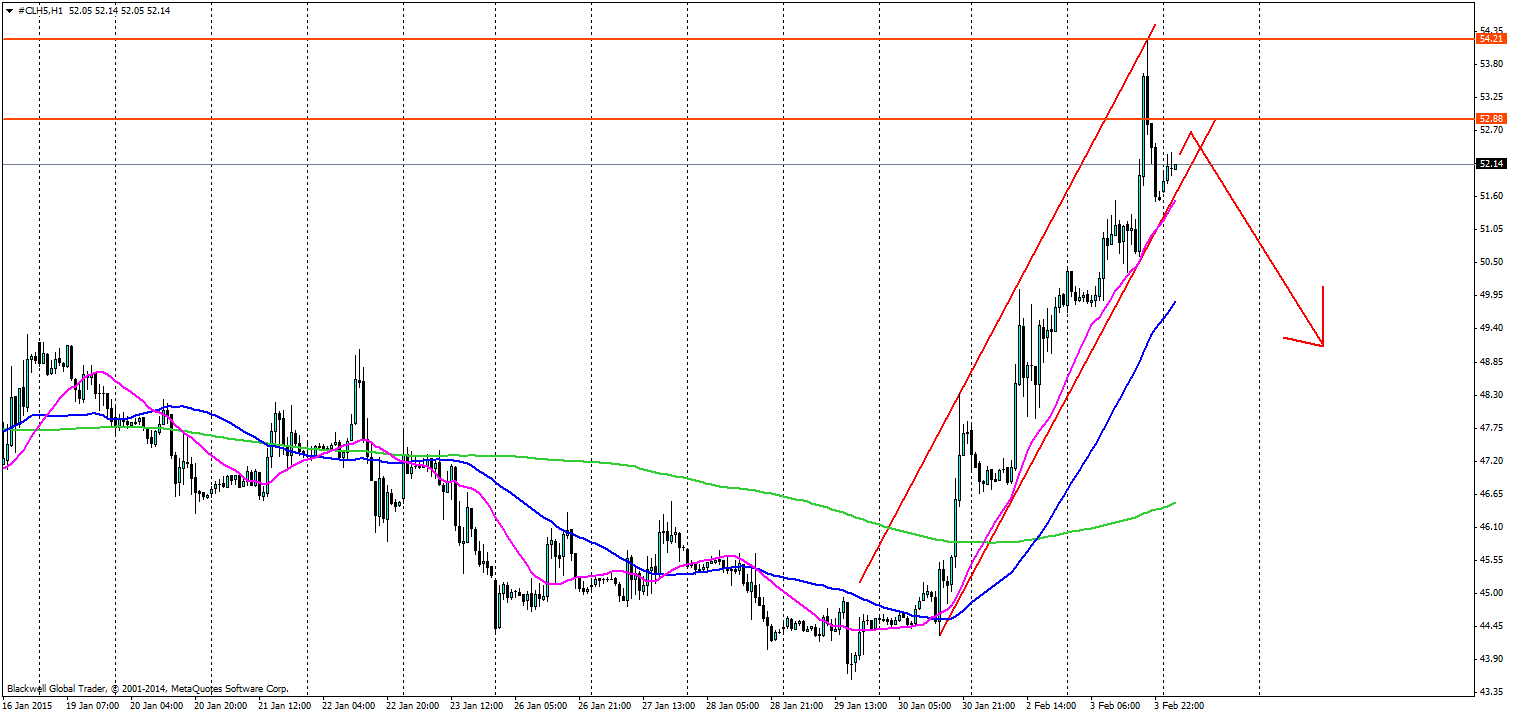
Source: Blackwell Trader (Oil, H1)
If you’re looking for a bearish move, then you’ve got options, but you may have to wait. A push back of 52.88 could lead to a breakthrough of the 20 MA - unlikely given the strong trend – which in turn would lead to a bearish rush down to the 50 MA as it looks to find support. The next level down would aim for support levels, but the market would most certainly rush down the 200 MA.
Overall, there are strong options for traders in the oil market at present. But the market is very volatile and turning points can make you very poor quickly without proper risk management. One thing that is clear is that we are in a bullish trend at present and we will have to wait to see if the market can sustain it – remember the steeper the trend the more likely it is to fail.
