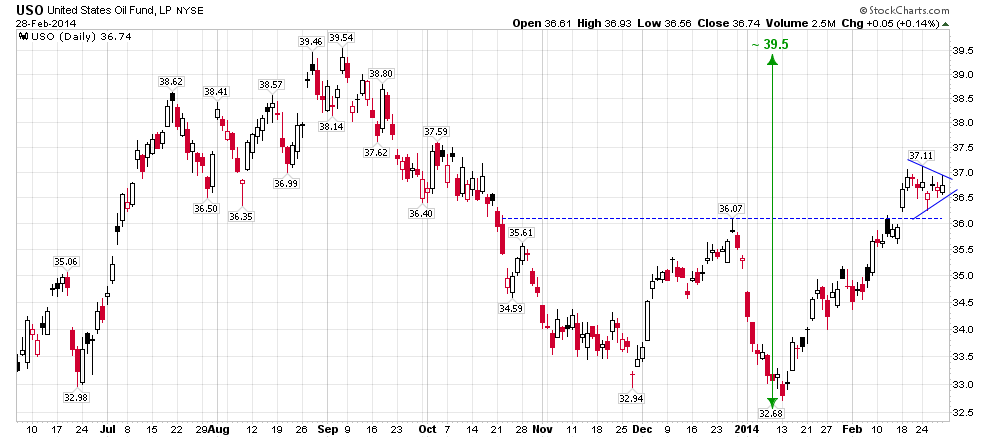
After forming a four-month interim double bottom the Oil ETF (USO) broke up through the neckline in the middle of February and has been consolidating since then in a small pennant - usually a continuation pattern. A measured move calculation gives us a potential target at ~39.5, the level of the past year highs.

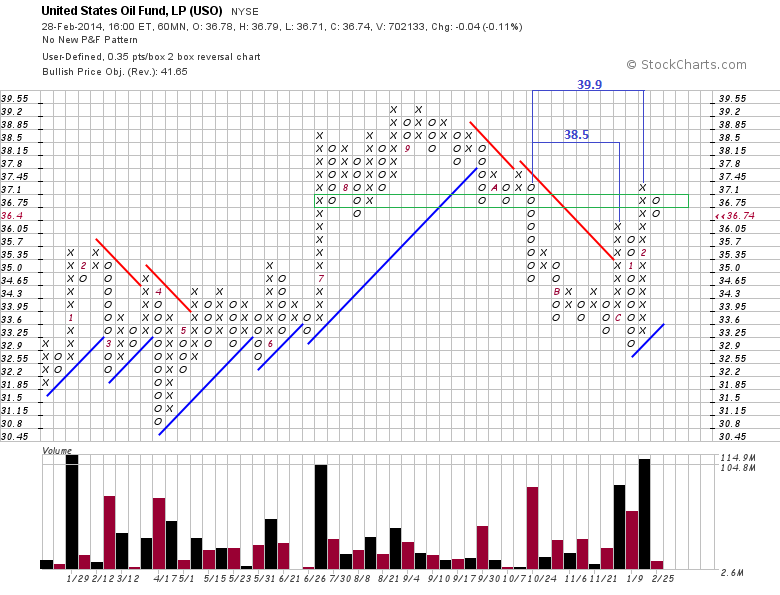
Two horizontal counts from the fulcrum bottom on the short horizon S&P chart point to the same area (38.5 and 39.9). High volume on the last two upward breakout columns indicates that demand is strong. Right now the price is battling against the minor resistance at 36.75.
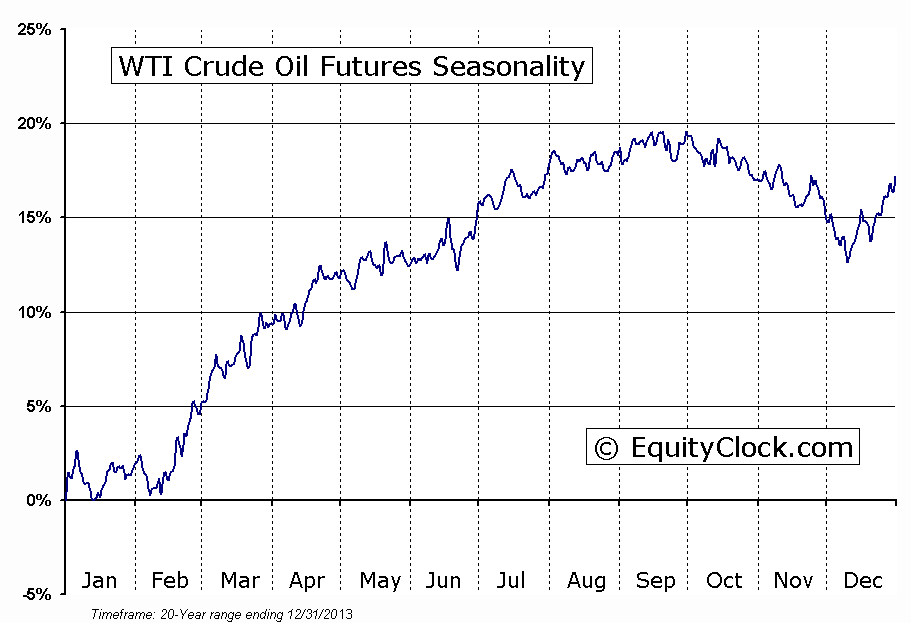
Also, pay attention that WTI Crude Oil has entered its seasonally strong period (chart from equityclock.com).
Disclosure: FX Solutions assumes no responsibility for errors, inaccuracies or omissions in these materials. FX Solutions does not warrant the accuracy or completeness of the information, text, graphics, links or other items contained within these materials. FX Solutions shall not be liable for any special, indirect, incidental, or consequential damages, including without limitation losses, lost revenues, or lost profits that may result from these materials.
The products offered by FX Solutions are leveraged products which carry a high level of risk to your capital with the possibility of losing more than your initial investment and may not be suitable for all investors. Ensure you fully understand the risks involved and seek independent advice if necessary.

