Talking Points
- Crude Oil Gains as US Weather Conditions Drive Heating Fuel Demand Bets
- DOE Inventories Figures May Warn of Increasing Supply and Weigh on WTI
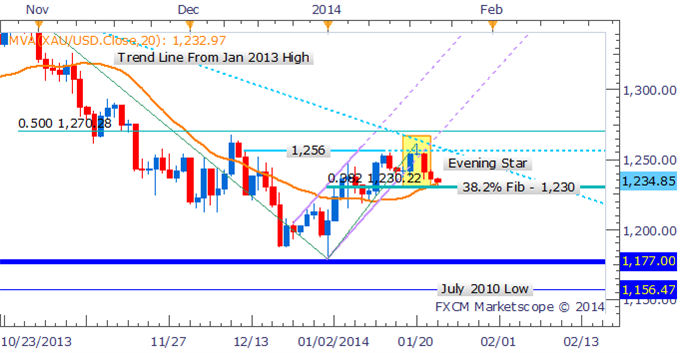
- Gold Finds Support Above $1,230 But May Decline on Upbeat US News-flow
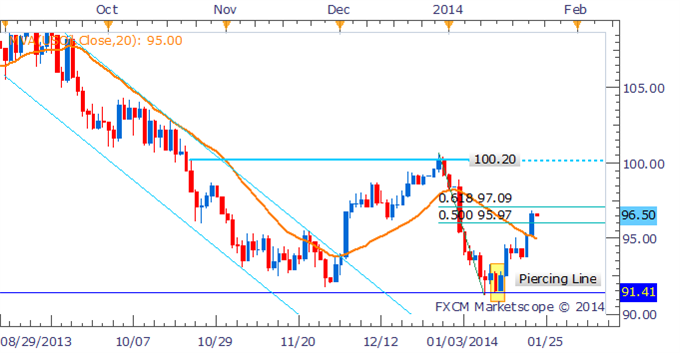
Crude Oil popped above the $96.50 handle in US trading for its third straight day of gains. The newswires attributed the rally to the ongoing cold snap on the East Coast, suggesting speculators were betting that the severe weather will create greater demand for heating fuel.
From here, traders are awaiting further directional guidance from the weekly DOE inventories report set to be released on Friday morning. Economists are expecting crude stockpiles to show a build of 1.15 million barrels, which would be the first rise since late November 2013. This would suggest that the supply of oil outpaced demand for the week which may be taken as a bearish signal by traders. A higher-than-anticipated print may also prompt some profit-taking following several days of strong momentum.
Upcoming US economic data may also prove noteworthy for the commodities space. Gold and silver have both suffered this week as firming Fed policy bets have weakened demand for the fiat money alternatives. An upside surprise to the upcoming US Jobless Claims and Existing Home Sales figures would strengthen calls for a more aggressive QE “taper” timeline from the Federal Reserve, and leave the precious metals vulnerable to further declines.
The DailyFX Speculative Sentiment Index is providing a mixed bias on gold.
CRUDE OIL TECHNICAL ANALYSIS – Crude is advancing towards resistance at the 61.8% Fibonacci retracement level near the $97 handle. A Piercing Line candlestick formation and move above the 20 SMA both provide a bullish bias. Support rests at the psychologically significant $96 mark.

Daily Chart - Created Using FXCM Marketscope 2.0
GOLD TECHNICAL ANALYSIS – An Evening Star candlestick formation is warning of further declines for gold. However, the yellow metal may find some buying support around the 38.2% Fibonacci retracement level.

Daily Chart - Created Using FXCM Marketscope 2.0
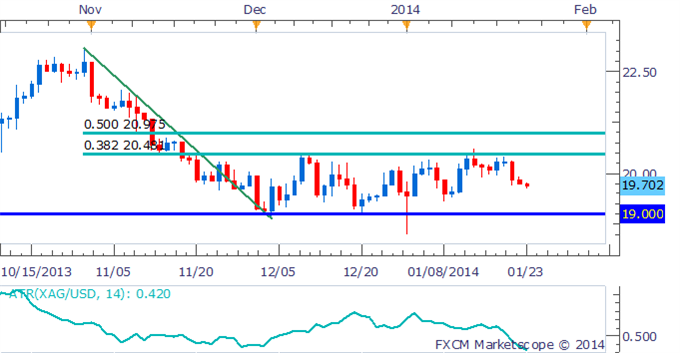
SILVER TECHNICAL ANALYSIS – The 14-day average true range for silver is resting at a multi-year low, suggesting the metal may continue to be range-bound. Upside resistance remains at $20.48, while buying support is sitting at $19.

Daily Chart - Created Using FXCM Marketscope 2.0
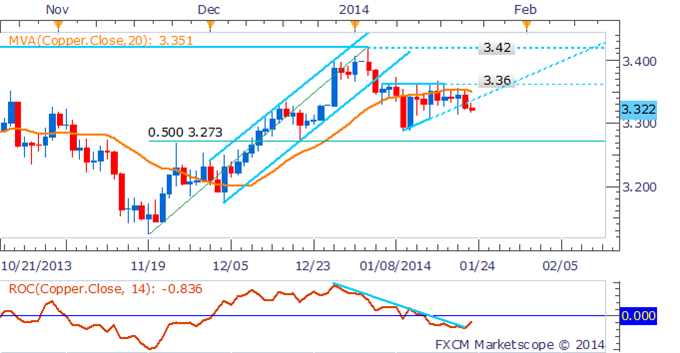
COPPER TECHNICAL ANALYSIS– Copper has broken below the ascending triangle pattern that had kept prices contained for the past couple of weeks. A lack of follow-through by traders, and fading momentum on the rate of change indicator suggests that sellers may struggle to push the commodity lower.

Daily Chart - Created Using FXCM Marketscope 2.0
--- Written by David de Ferranti, Market Analyst, FXCM Australia
