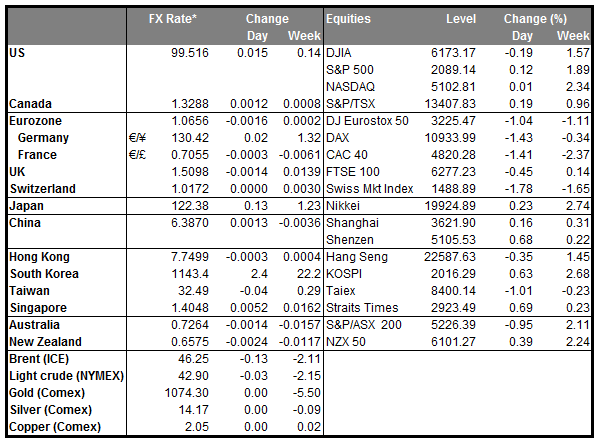
• Oil takes another hit as Chinese data show weakness After a minor recovery started on Dec. 21st, oil prices reversed some of the gains yesterday, following the release of weak Chinese industrial profit data on Sunday. In a low liquidity market with very few indicators being released, falling industrial profits were enough to push the prices of oil back to the downside, as falling profits suggest less demand for commodities by Chinese firms. The resumed downturn in oil prices brought renewed selling pressure on the Canadian dollar throughout the day, though the currency recovered some of the day’s losses during the early Asian session today. As far as the other oil currencies are concerned, USD/NOK exhibited a lot of volatility, but remained more or less unchanged. Nevertheless, on a longer term perspective both CAD and NOK are showing clear downtrends. With the global markets preparing for the prospect of Iranian oil returning to the market in 2016, and since the nation has reiterated its willingness to bring exports back to pre-sanctions levels, we could see CAD and NOK to remain under selling pressure in the foreseeable future.
• Today’s highlights: We only get two indicators, both from the US. The SnP/Case-Shiller composite house price index for October is forecast to have slowed slightly from the previous month. Even with the anticipated slowdown, home prices are still rising approximately twice as fast as incomes, threatening the total number of home sales as some potential buyers may be kept out of the market. Nevertheless, as wages and employment continue to improve, expectations are for the housing market to remain supported in the foreseeable future. Over the long term though, rising interest rates could hurt housing affordability.
• The Conference Board consumer confidence index for December is also coming out and is expected to have increased following November’s sudden decline. The forecast is partially supported by the final U o M consumer sentiment index for the same month which increased to its highest level since July, as lower inflation boosted real incomes. Moreover, the December plunge in oil prices would have left many consumers enjoying higher disposable incomes, which may add to the consensus for an improvement in consumer confidence.
• Since the indicators are expected to show mixed results, we could see the consumer confidence index to overshadow the house price index, especially as the housing data are outdated. Bearing in mind that spending accounts for almost 70% of GDP, if the forecast is met, we could see the dollar trade somewhat higher, particularly in the midst of a very thin market.
• We have no speakers scheduled on Tuesday’s agenda.
The Market
EUR/USD stays near 1.0985
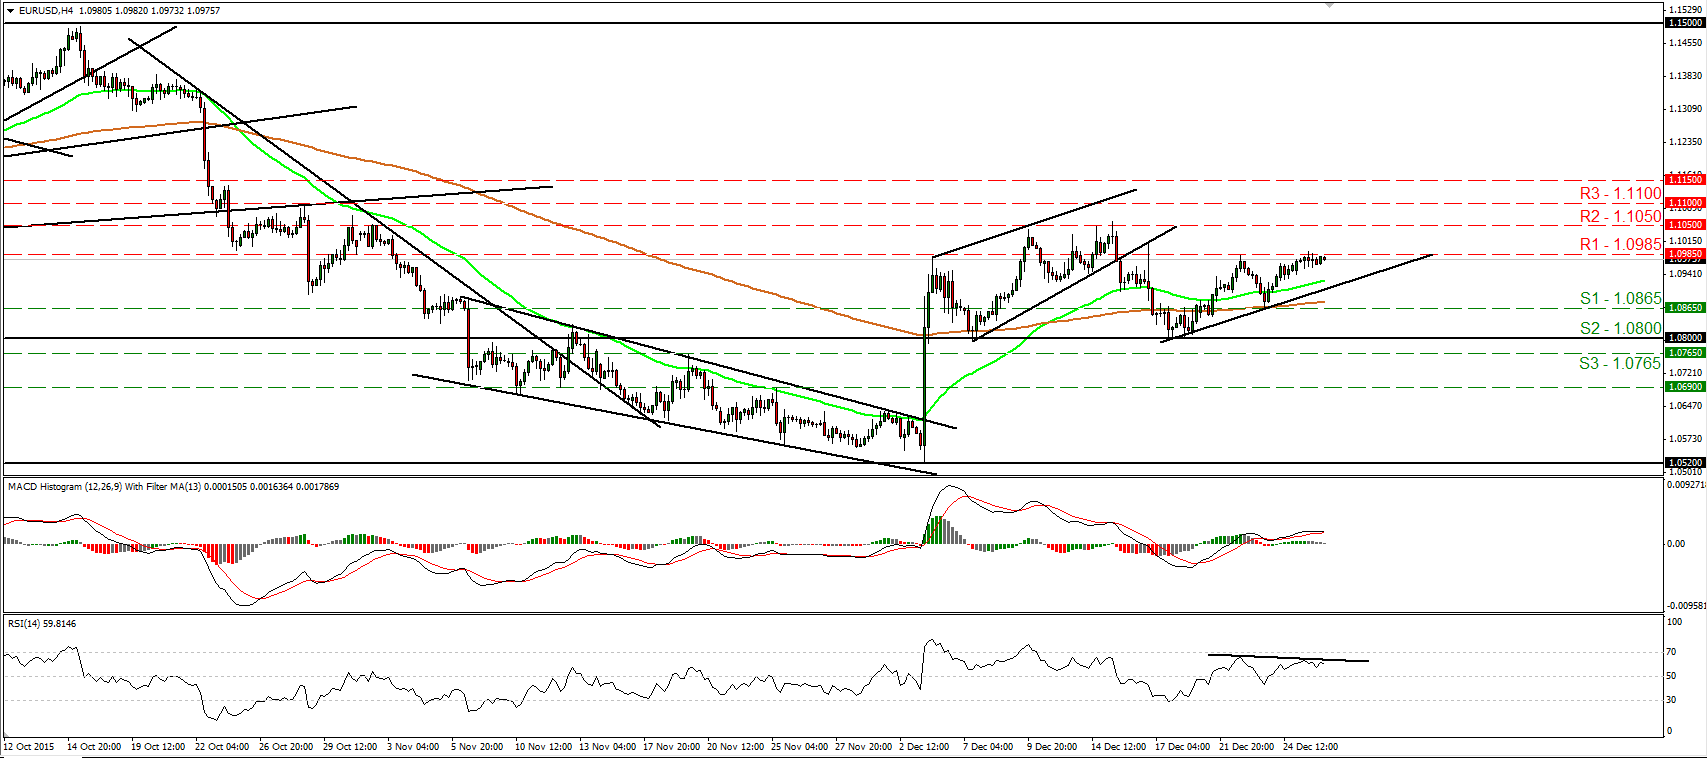
• EUR/USD traded in a consolidative manner yesterday after it tested the 1.0985 (R1) resistance hurdle, marked by the peak of the 22nd of December. I still believe that a clear break above that hurdle would confirm a forthcoming higher high on the 4-hour chart and could set the stage for extensions towards our next obstacle area of 1.1050 (R2). Nevertheless, our short-term momentum studies now give evidence that a minor setback could be in the works before and if buyers decide to shoot again. The RSI has topped and could edge down for a test at its 50 line, while the MACD, although positive, shows signs of topping and could fall below its signal line soon. Switching to the daily chart, I see that on the 7th and 17th of December, the rate rebounded from the 1.0800 (S2) key hurdle, which is also the lower bound of the range it had been trading from the last days of April until the 6th of November. As a result, although I believe EUR/USD is possible to continue higher in the short run, I prefer to maintain my neutral stance as far as the overall outlook is concerned.
• Support: 1.0865 (S1), 1.0800 (S2), 1.0765 (S3)
• Resistance: 1.0985 (R1), 1.1050 (R2), 1.1100 (R3)
GBP/JPY falls and hits once again support at 179.00
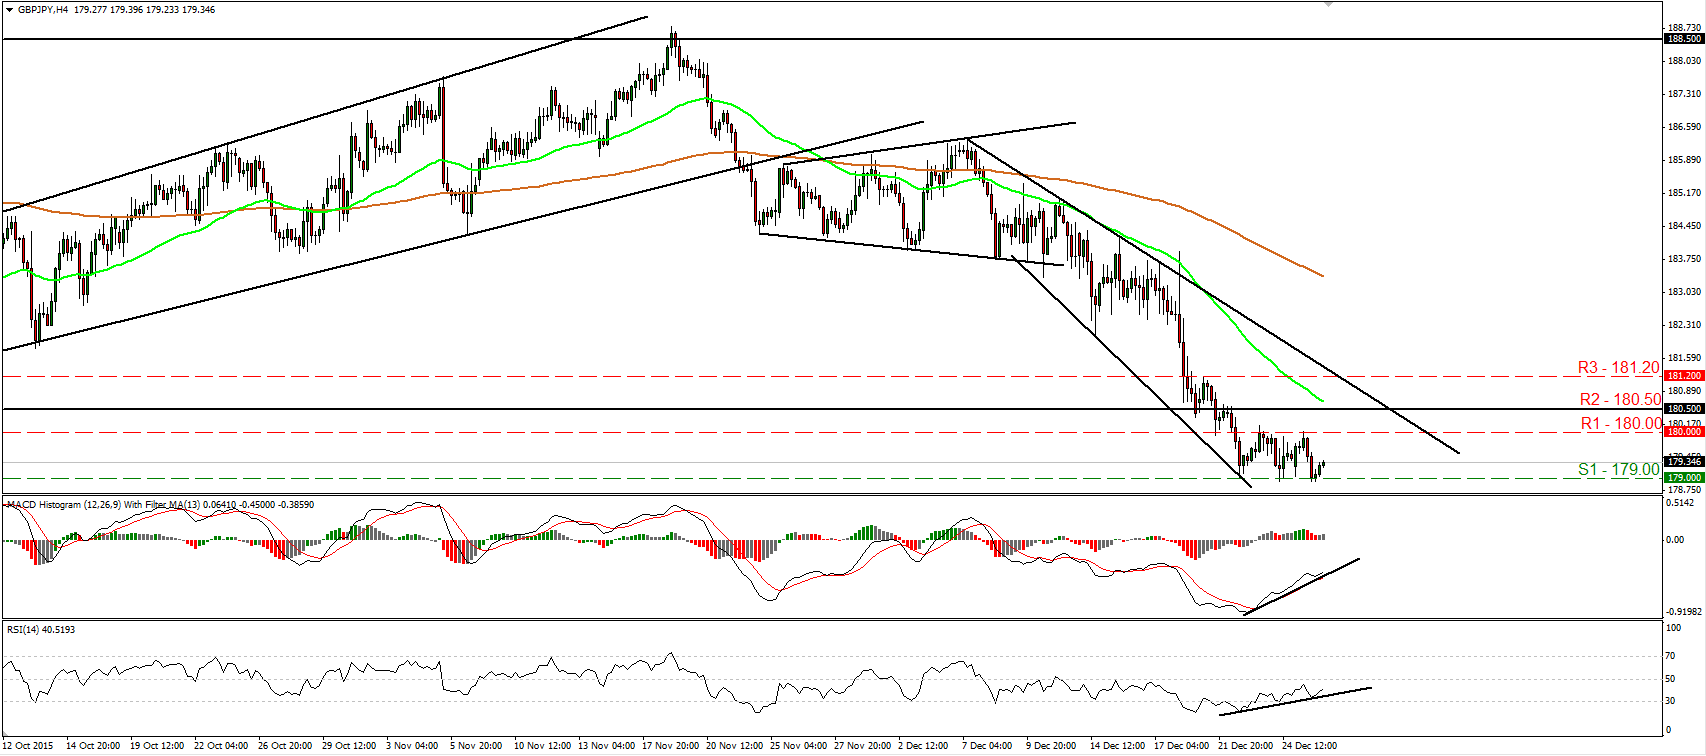
• GBP/JPY traded lower on Monday after it hit resistance near the psychological zone of 180.00 (R1). However, the decline was stopped once again by the support line of 179.00 (S1). Then the pair rebounded somewhat. Although I see the possibility for the rebound to continue and challenge once again the 180.00 (R1) zone, as long as the rate is trading between that hurdle and the 179.00 (S1) line, I would consider the short-term bias to be neutral for now. Shifting my attention to our near-term momentum studies, I see that the RSI rebounded from near its 30 line, while the MACD, although negative, stands above its trigger line and points north. These signs corroborate my view that we are likely to see another test near 180.00 (R1). As for the broader trend, on the 21st of December the rate fell below the 180.50 (R2) key hurdle, which is the lower bound of the wide range it has been trading since the 25th of August. Therefore, I would see a negative longer-term picture and I would treat any further short-term advances that stay limited below 180.50 (R2) as a corrective phase.
• Support: 179.00 (S1), 178.50 (S2), 178.00 (S3)
• Resistance: 180.00 (R1), 180.50 (R2), 181.20 (R3)
AUD/USD rebounds from 0.7240
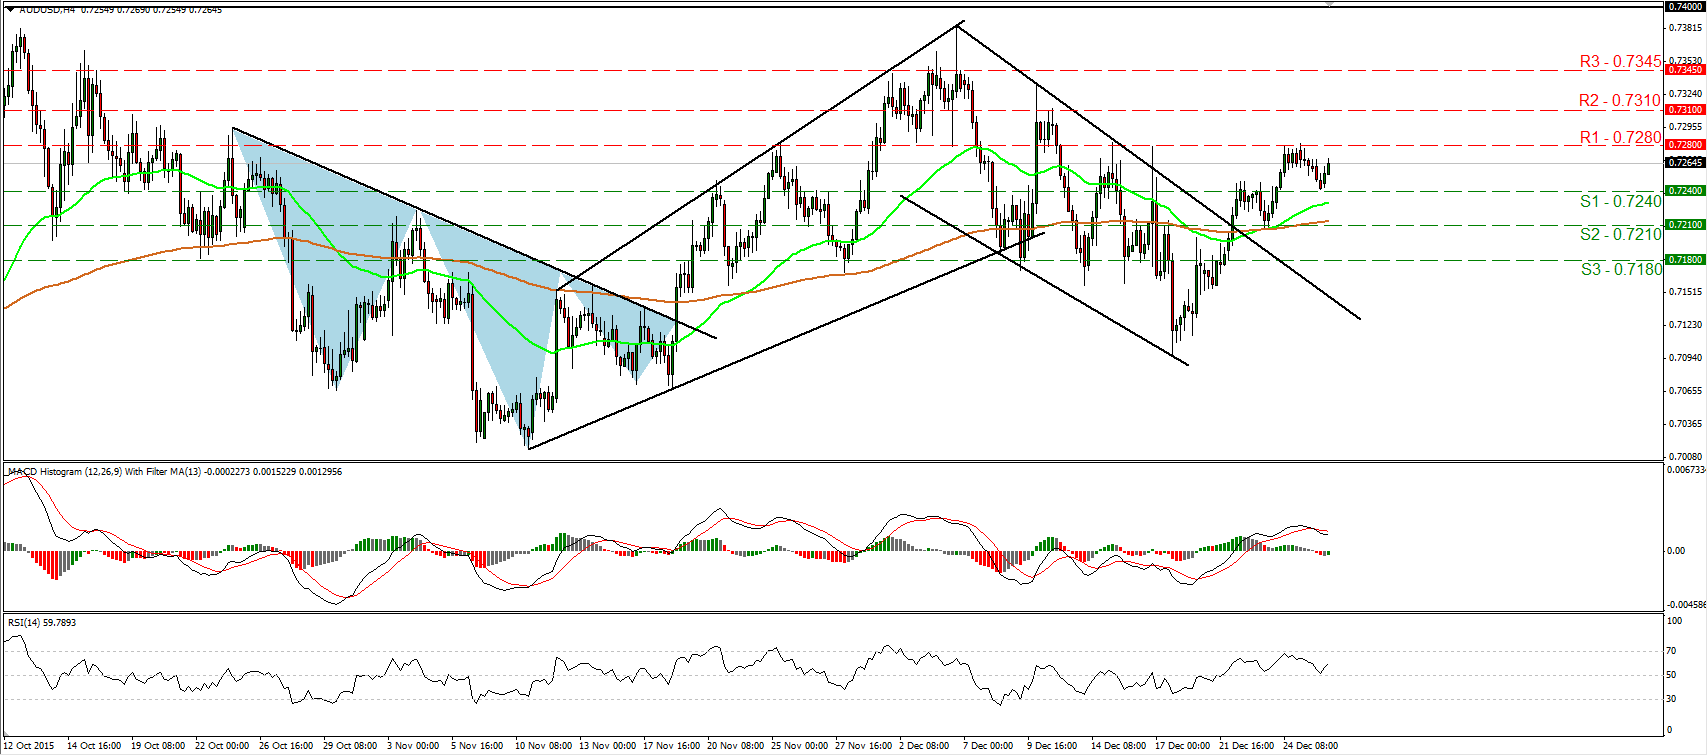
• AUD/USD slid on Monday after it hit resistance at 0.7280 (R1). Nevertheless, the rate hit support at the 0.7240 (S1) level and then it rebounded. Given that the pair is trading above the downtrend line taken from the peak of the 4th of December, and that the price structure has been higher peaks and higher lows since then, I would see a positive short-term picture. In my opinion, a break above 0.7280 (R1) would confirm a forthcoming higher high on the 4-hour chart and is likely to set the stage for extensions towards the 0.7310 (R2) obstacle, marked by the peak of the 10th of December. Our short-term oscillators detect positive momentum and support the notion. The RSI rebounded from near its 50 line and is now pointing up, while the MACD, already positive, shows signs of bottoming and that it could cross above its trigger line soon. On the daily chart, I see that AUD/USD is trading within a range between 0.6900 and 0.7400 since mid-July. As a result, although we may experience some further near-term advances, I would hold a flat stance for now as far as the broader trend is concerned.
• Support: 0.7240 (S1), 0.7210 (S2), 0.7180 (S3)
• Resistance: 0.7280 (R1), 0.7310 (R2), 0.7345 (R3)
Gold hits a prior downtrend line and rebounds
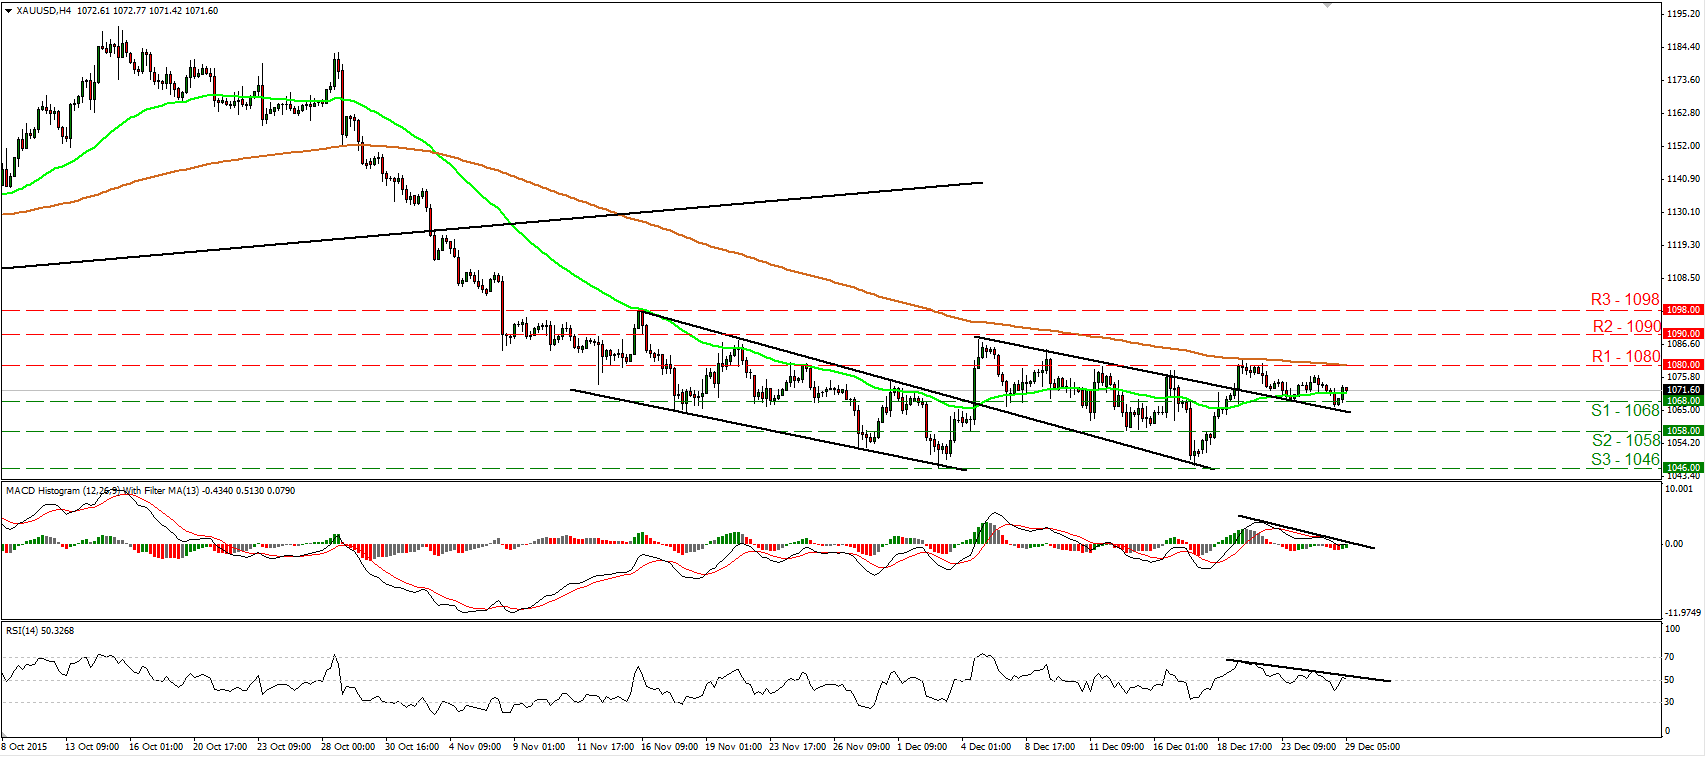
• Gold traded somewhat lower yesterday, but hit support near the prior downtrend line drawn from the peak of the 4th of December and then it rebounded. The metal stayed between the support level of 1068 (S1) and the 1080 (R1) resistance zone, and although it lies above the aforementioned trend line, I prefer to see a clear move above 1080 (R1) before I get more confident on the upside. Something like that could aim for the 1090 (R2) area, defined by the peaks of the 20th of November and 4th of December. Looking at our oscillators, I see that they both stand below their downside resistance lines. What is more, the RSI has turned down and could fall back below 50, while the MACD, already below its trigger line, looks ready to turn negative. These momentum signs is another reason I would prefer to see a break above 1080 (R1) before trusting further short-term advances. As for the broader trend, a decisive close above 1090 (R2) is likely to signal the completion of a double bottom formation on the daily chart and could turn the medium-term outlook to the upside. For now, I stay flat as far as the longer-term picture is concerned.
• Support: 1068 (S1), 1058 (S2), 1046 (S3)
• Resistance: 1080 (R1), 1090 (R2), 1098 (R3)
DAX futures hit support at 10625
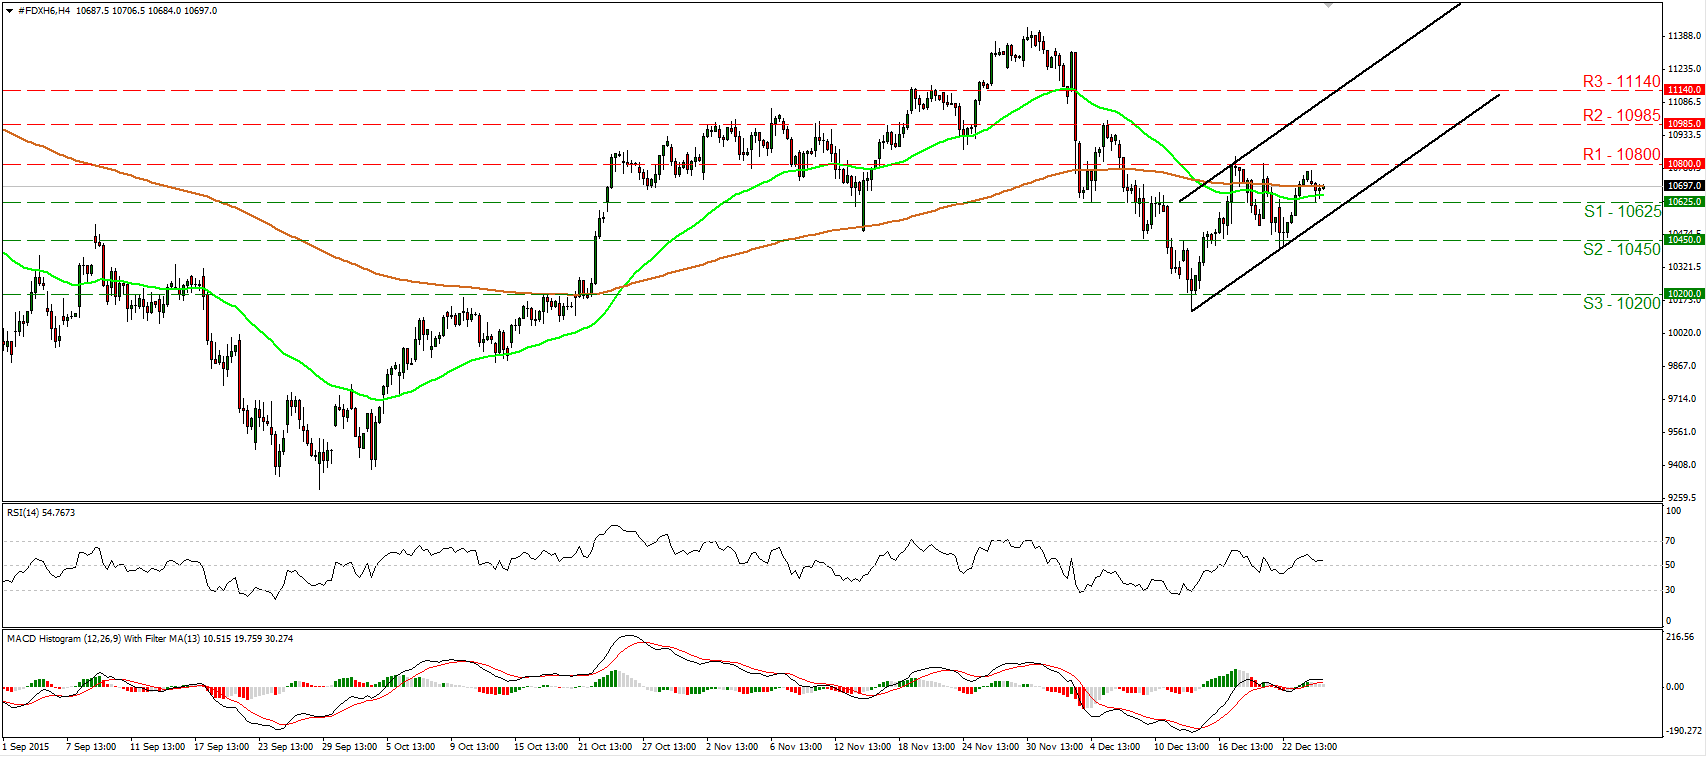
• DAX futures traded slightly lower yesterday after hitting resistance marginally below the 10800 (R1) resistance barrier. Nevertheless, the retreat was stopped at 10625 (S1) and then the index rebounded somewhat. Since the price is trading within an upside channel that has been containing the price action since the 14th of December, I would consider the short-term picture to be cautiously positive. A clear move above 10800 (R1) would confirm a forthcoming higher high on the 4-hour chart and could open the way for our next resistance of 10985 (R2), marked by the peak of the 7th of December. As for the broader trend, the price structure on the daily chart points to a downtrend. As a result I would treat the short-term uptrend as a corrective phase for now. I prefer to see a close below 10200 (S3) to trust that the outlook is back to the downside.
• Support: 10625 (S1), 10450 (S2), 10200 (S3)
• Resistance: 10800 (R1), 10985 (R2), 11140 (R3)

