Gold has been in the limelight. After a sharp decline to a low in late 2015 it recovered in mid 2016. It pulled back to a higher low and now has mounted another assault on the 2016 high. A break above it would be a very bullish signal and confirm a reversal. This has garnered a lot of attention for Gold, and to some degree has masked the relative strength in Crude Oil.
While Gold has been flirting with a reversal, Crude Oil has had a stellar run higher. It too had a steep decline, bottoming in early 2016. And then mounted a move to the upside that gathered strength into the end of last year. On its own Crude Oil has shown strength and continues to do so. But it is near a break out now relative to Gold.
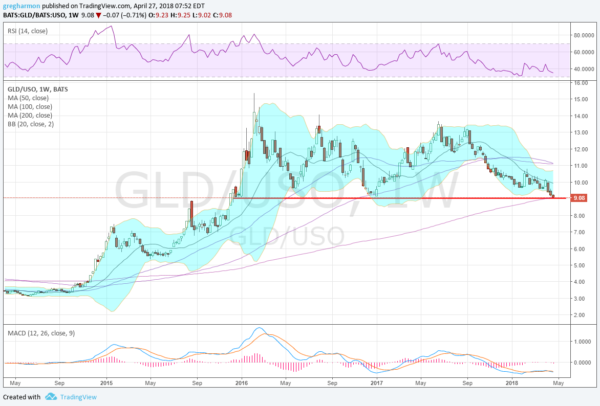
 The ratio chart above shows the long sideways price action since the beginning of 2016 of Gold priced in Crude Oil. It has found support many times along that path at a ratio of 9:1. As we head into the end of April the ratio is just over 9:1 and at its 200 week SMA. It has not been there since the start of the Gold out-performance at the end of 2014. Momentum is bearish as well with the RSI in the bearish zone and the MACD negative and falling. A break of this support would be a major reversal in strength between the pair.
The information in this blog post represents my own opinions and does not contain a recommendation for any particular security or investment. I or my affiliates may hold positions or other interests in securities mentioned in the Blog, please see my Disclaimer page for my full disclaimer.
