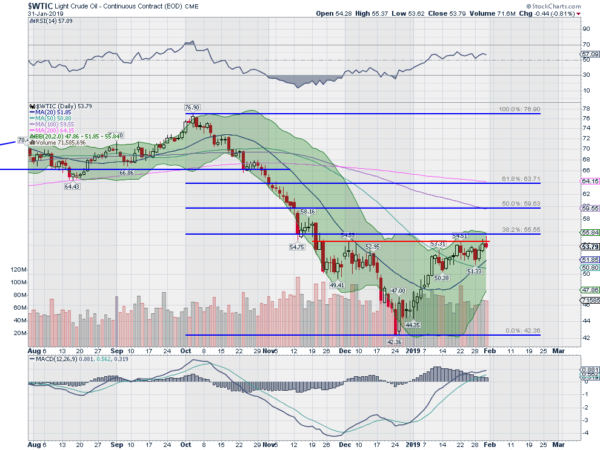
Crude Oil fell with the stock market in October. It continued to move down to a bottom in December on Christmas Eve and then bounced. Crude Oil has been acting just like a stock. That correlation may have slipped the past couple of weeks though with Crude Oil stalling at resistance while stock continued higher.
A closer look at the chart for Crude Oil shows real promise for more upside though. The small pause and bounce in November on the way down, and then the recent drift back and reversal, have created a possible Inverse Head and Shoulders pattern in the price action.

The neckline of the pattern at about 54.50, sits just below a 38.2% retracement of the drop from October. A break above the neckline gives a target to about 66. This would bring Crude Oil back over the 200 day SMA and the 61.8% retracement. Momentum is on the edge of the bullish zone with the RSI running flat just under 60, while the MACD is positive. Keep an eye on this chart.
The information in this blog post represents my own opinions and does not contain a recommendation for any particular security or investment. I or my affiliates may hold positions or other interests in securities mentioned in the Blog, please see my Disclaimer page for my full disclaimer.
