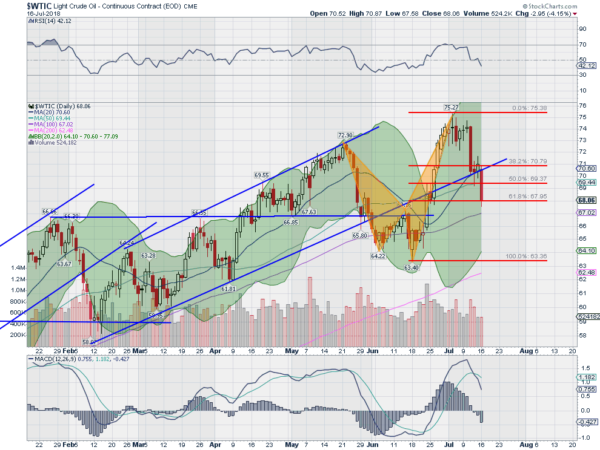
Crude Oil had a great start to the beginning of the year. From a February low under $60 it rose to a top in May near $73 per barrel. It rose in a channel and from that May top started to pullback to the bottom of the channel as it rejected at 2 year highs. All looked okay, a healthy pullback in the channel until it broke to the downside at the end of May. Oil had shifted into a new pattern.
From the May high until the higher high in June it traced out a bearish Shark harmonic. It completed the pattern at the end of June and paused before acting out the bearish aspect of it. The first move down was quick, pulling back to the bottom of the prior channel, the 20 day SMA and a 38.2% retracement of the pattern. With all that going on it was no wonder that it paused there.

It held there over the channel through the rest of the week. Monday changed that. It made a second leg lower, retracing 61.8% of the pattern. This is the second target of the retracement and would be a good place to stall again. Early action Tuesday shows the price holding. But a deeper look at the chart shows the 100 day SMA just below and coinciding with the important prior price level at 66.50. Momentum remains in bullish ranges with the RSI over 40 and the MACD positive. But both momentum gauges are sinking fast. Should it continue to spill down further the next target would be a full retracement of the pattern to 63.40.
The information in this blog post represents my own opinions and does not contain a recommendation for any particular security or investment. I or my affiliates may hold positions or other interests in securities mentioned in the Blog, please see my Disclaimer page for my full disclaimer.
