Selloff or Market Correction? Either Way, Here's What to Do NextSee Overvalued Stocks

Oil Signaling Lower Lows

Published 08/19/2015, 04:43 AM
Updated 05/14/2017, 06:45 AM
USD/CNY
-
CL
-

Oil has found a little support over the last 24 hours, thanks to a stronger than expected draw on inventories. This has only led to a rejection off the trend line and lower lows look to be the target.

The American Petroleum Institute released their weekly Crude Oil inventories report at the end of yesterday’s New York session which gave crude a nice little boost. The report showed a draw on reserves of -2.3Million barrels and was a little higher than the market was expecting, as seen by the pop on the release. That only lasted a short while though, with Oil pulling back from the day’s high after a touch on the trend line. This is quite a bearish sign if Oil can’t capitalise on such a large draw-down and it shows the strength of this bearish trend.

It will pay to keep an eye on the official EIA report due out later today (1430 GMT) with the market expecting a draw of 800k barrels. Judging by the market’s reaction to the API result, it will need to take something spectacular to turn the sentiment around from the bearish bias that currently persists. The troubles in China are only likely to compound the problems in the Oil market with another solid fall in the stock market today likely to cause another yuan devaluation from the PBOC.
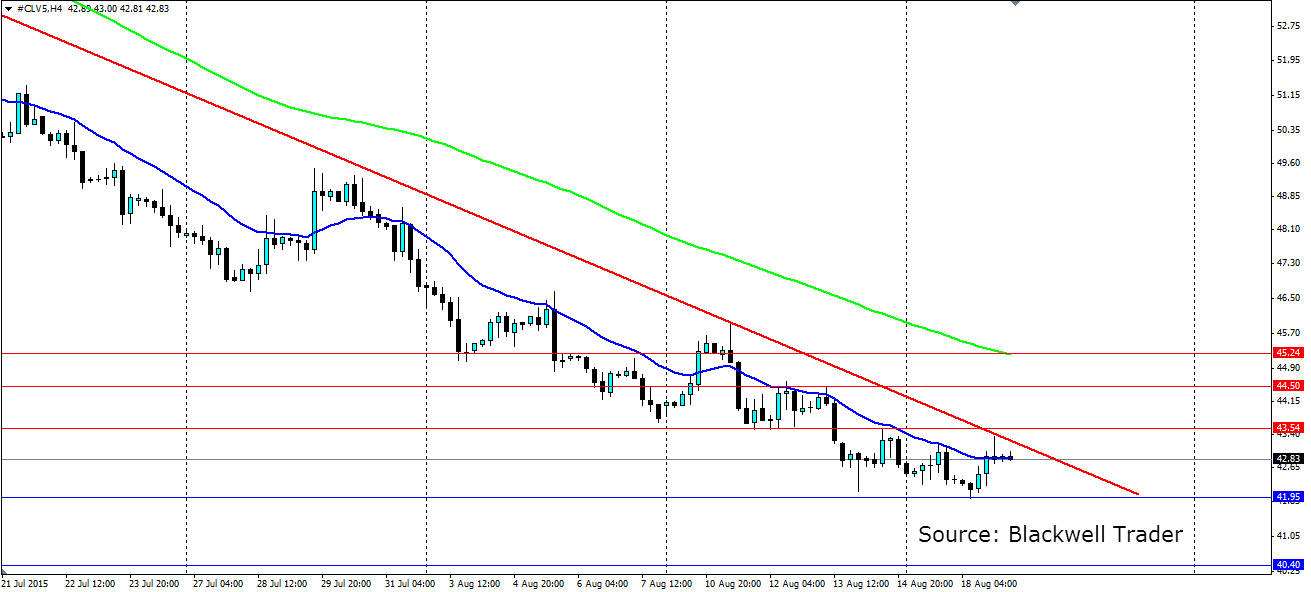
Oil 4-H Chart

The doji that formed on the H4 chart, above, after the API report is a clear sign of the markets sentiment. Oil was bid up towards the trend line where it rejected strongly to close out below where it opened the candle. The trend line is firmly in control and provides an opportunity for traders to enter short with the bias.

From here we are likely to see the recent lows tested at $41.95. Below that we are into levels not seen in 6 years, so looking back we have support at 40.40, 39.48 and 37.43 which will all be points of interest for Oil. If we do see a breakout of the trend, look for resistance to be found at 43.54, 44.50 and 45.24.

Latest comments

Loading next article…
Risk Disclosure: Trading in financial instruments and/or cryptocurrencies involves high risks including the risk of losing some, or all, of your investment amount, and may not be suitable for all investors. Prices of cryptocurrencies are extremely volatile and may be affected by external factors such as financial, regulatory or political events. Trading on margin increases the financial risks.
Before deciding to trade in financial instrument or cryptocurrencies you should be fully informed of the risks and costs associated with trading the financial markets, carefully consider your investment objectives, level of experience, and risk appetite, and seek professional advice where needed.
Fusion Media would like to remind you that the data contained in this website is not necessarily real-time nor accurate. The data and prices on the website are not necessarily provided by any market or exchange, but may be provided by market makers, and so prices may not be accurate and may differ from the actual price at any given market, meaning prices are indicative and not appropriate for trading purposes. Fusion Media and any provider of the data contained in this website will not accept liability for any loss or damage as a result of your trading, or your reliance on the information contained within this website.
It is prohibited to use, store, reproduce, display, modify, transmit or distribute the data contained in this website without the explicit prior written permission of Fusion Media and/or the data provider. All intellectual property rights are reserved by the providers and/or the exchange providing the data contained in this website.
Fusion Media may be compensated by the advertisers that appear on the website, based on your interaction with the advertisements or advertisers.
© 2007-2024 - Fusion Media Limited. All Rights Reserved.