On Mar 21 I posted diagrams showing a poor performance of the Energy sector over the past month and the Oil Equipment and Services industry in particular.
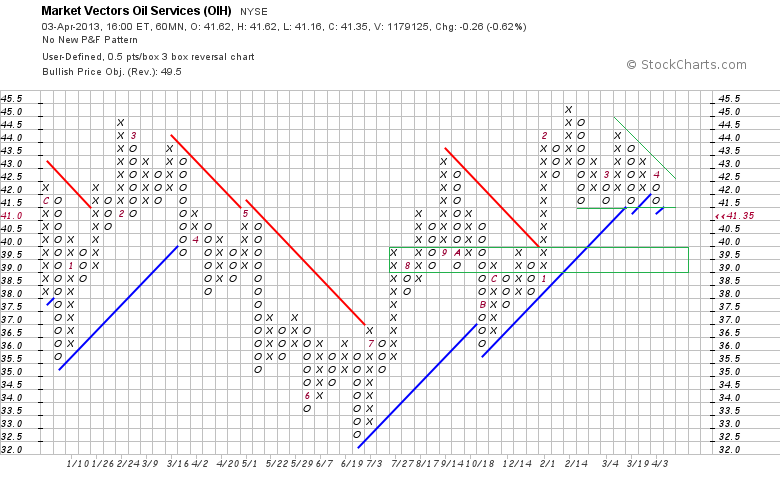
Since then the Market Vectors Oil Services ETF (OIH) plotted a very interesting pattern on the medium horizon P&F chart.
The March consolidation is unfolding as a Downside Triangle (green) with the lower border at 41.50. If the weakness in OIH continues then the ETF can fall to 41 reversing the medium-term uptrend and issuing a strong Quadruple Bottom sell signal with the next support area at 39-39.50 (green rectangle). 
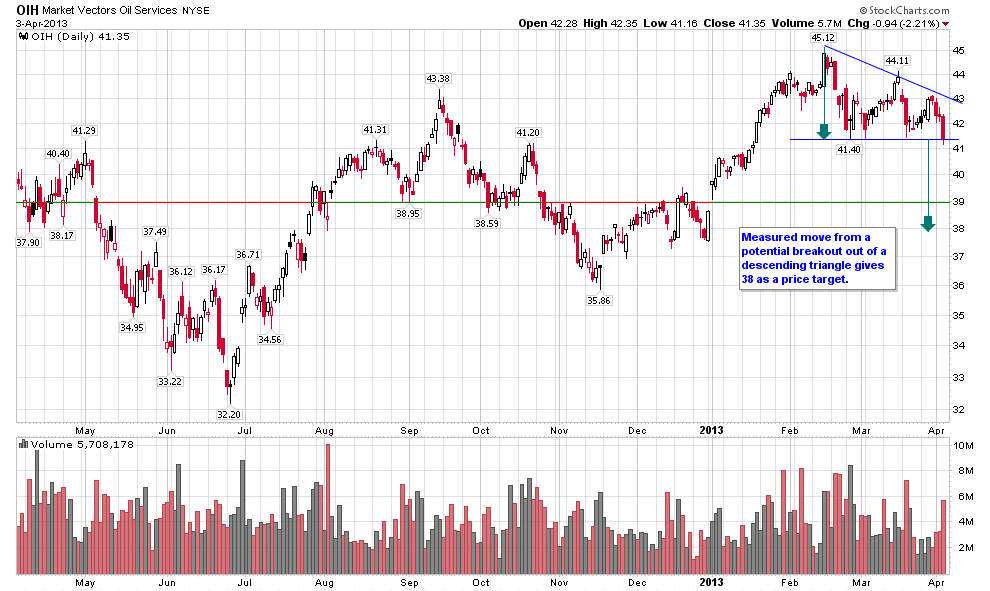
Measured move calculated from the height of a descending triangle on the candle chart gives 38 as a potential price target. 
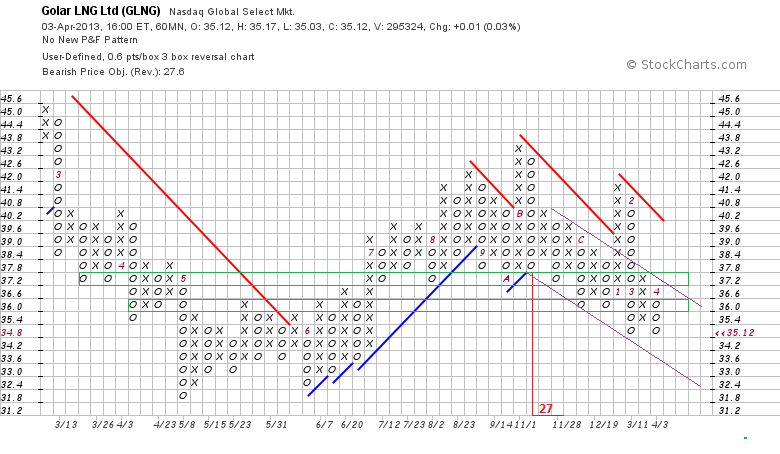
GLNG, which I have a position in, tested resistance at 37.2 and the upper boundary of a falling trendchannel (purple) and reversed back.
At the 37 resistance level I added puts to my position for the short-term trade on Mar 26. I sold this part of puts today in the morning when GLNG fell to the 35.4 level.
Sold to close GLNG May13 35 Put 10 contracts at $1.00
Disclaimer: I express only my personal opinion on the market and do not provide any trading or financial advice (see Disclaimer on my site).
- English (UK)
- English (India)
- English (Canada)
- English (Australia)
- English (South Africa)
- English (Philippines)
- English (Nigeria)
- Deutsch
- Español (España)
- Español (México)
- Français
- Italiano
- Nederlands
- Português (Portugal)
- Polski
- Português (Brasil)
- Русский
- Türkçe
- العربية
- Ελληνικά
- Svenska
- Suomi
- עברית
- 日本語
- 한국어
- 简体中文
- 繁體中文
- Bahasa Indonesia
- Bahasa Melayu
- ไทย
- Tiếng Việt
- हिंदी
Oil Services ETF Formed Descending Triangle
Published 04/04/2013, 02:56 AM
Updated 07/09/2023, 06:31 AM
Oil Services ETF Formed Descending Triangle
Latest comments
Loading next article…
Install Our App
Risk Disclosure: Trading in financial instruments and/or cryptocurrencies involves high risks including the risk of losing some, or all, of your investment amount, and may not be suitable for all investors. Prices of cryptocurrencies are extremely volatile and may be affected by external factors such as financial, regulatory or political events. Trading on margin increases the financial risks.
Before deciding to trade in financial instrument or cryptocurrencies you should be fully informed of the risks and costs associated with trading the financial markets, carefully consider your investment objectives, level of experience, and risk appetite, and seek professional advice where needed.
Fusion Media would like to remind you that the data contained in this website is not necessarily real-time nor accurate. The data and prices on the website are not necessarily provided by any market or exchange, but may be provided by market makers, and so prices may not be accurate and may differ from the actual price at any given market, meaning prices are indicative and not appropriate for trading purposes. Fusion Media and any provider of the data contained in this website will not accept liability for any loss or damage as a result of your trading, or your reliance on the information contained within this website.
It is prohibited to use, store, reproduce, display, modify, transmit or distribute the data contained in this website without the explicit prior written permission of Fusion Media and/or the data provider. All intellectual property rights are reserved by the providers and/or the exchange providing the data contained in this website.
Fusion Media may be compensated by the advertisers that appear on the website, based on your interaction with the advertisements or advertisers.
© 2007-2025 - Fusion Media Limited. All Rights Reserved.
