The longer term recovery for oil which peaked in the $52 per barrel area last month, is now reversing once more and picking up bearish momentum ahead of the weekly oil inventories due for release later today, as both the technical and fundamental picture help to drive prices lower once again. From a fundamental perspective, over supply remains the dominant factor, and coupled with weak economic data and the continuing price war with the alternative suppliers, all adding to the mix. A strengthening US dollar is also contributing, and with both the CRB index and the Baltic Dry Index turning lower, the outlook for commodities in general, and oil in particular remains bearish in the short to medium term. The forecast for oil inventories this afternoon is a draw of -2.1m bls against a previous of -2.3m bls, and despite the run of draws from Cushing over the last few weeks, this has done little to halt the weight of sentiment driving prices lower, with CFTC data also confirming the build in net short positions, with long positions hitting their lowest level since early March.

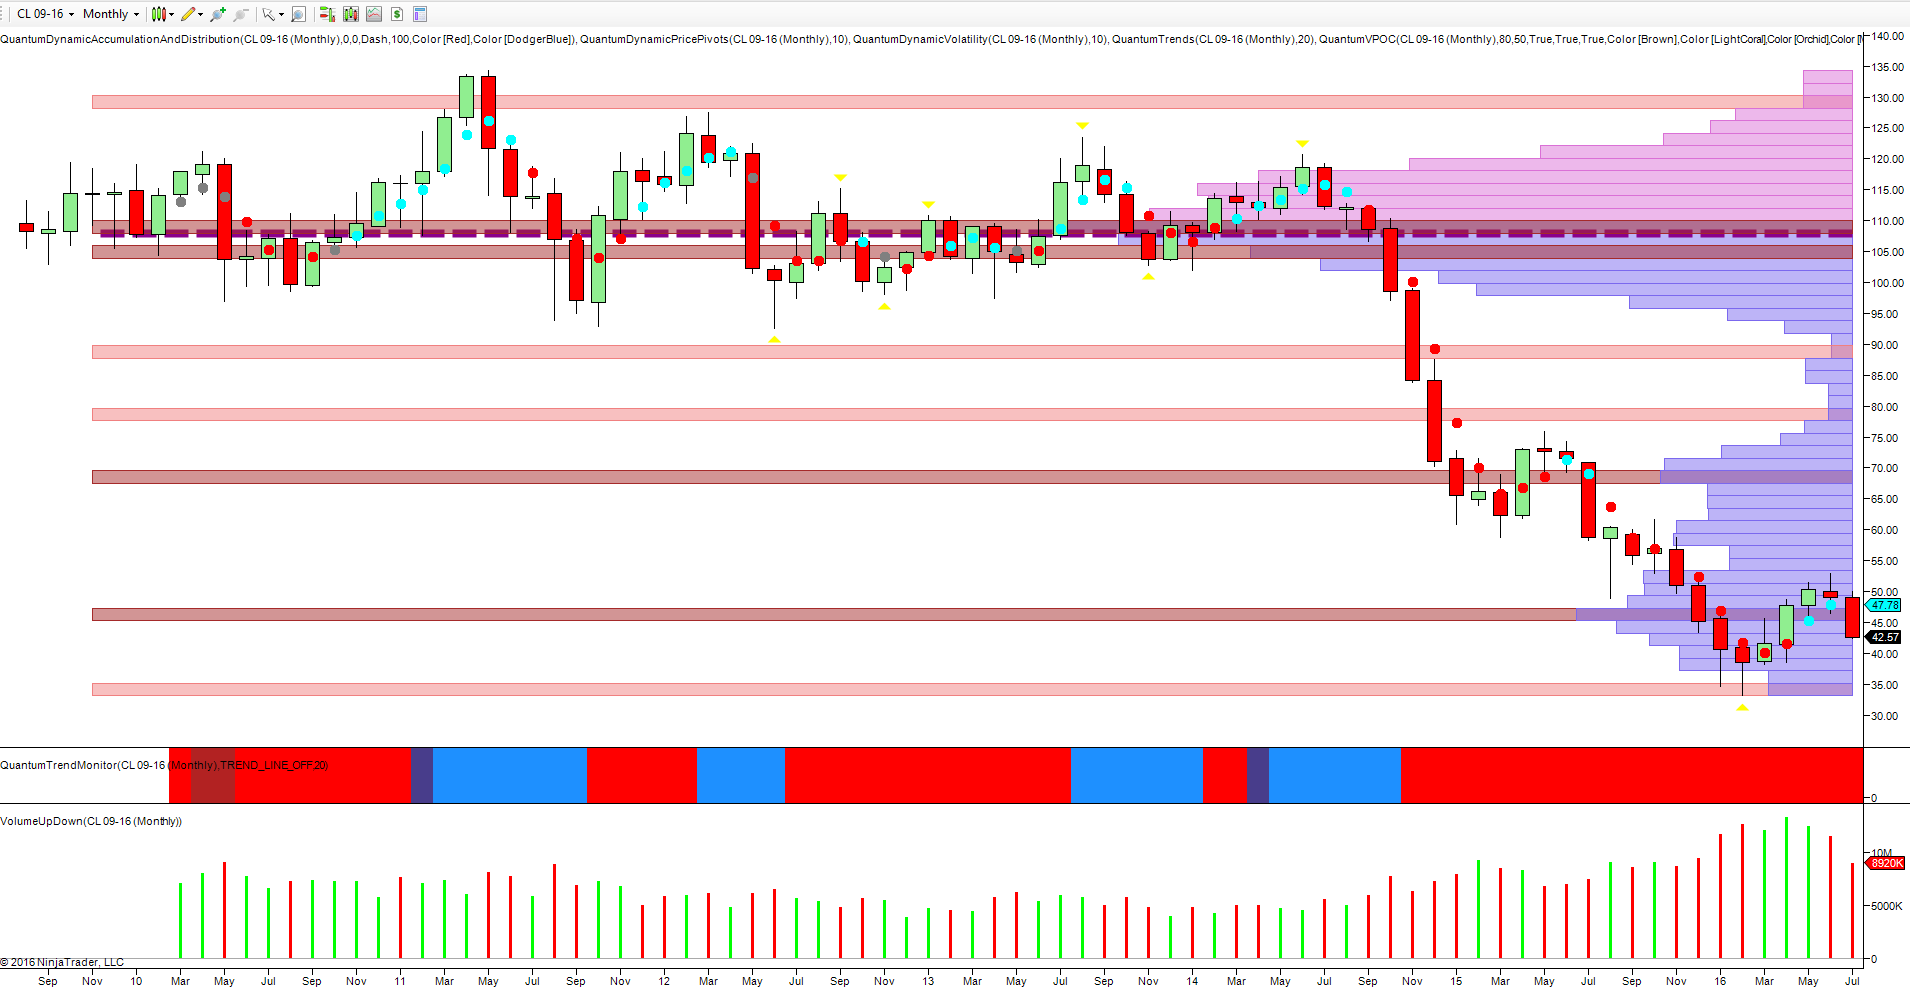
Moving to the technical picture, the slower time frames complete the picture, and if we start with the monthly chart this tells it own story, with the ultra high volume of May on a narrow spread price candle, signalling the end of the rally. June’s candle then confirmed this weak picture with July then delivering the coup de grace, with oil selling off sharply and trading at $42.54 for the WTI contract at time of writing. Should this candle close the month below the high volume node in the $46 per barrel area, then we can expect to see further downside momentum in due course, with a possible test of support in the $37 per barrel area in due course.

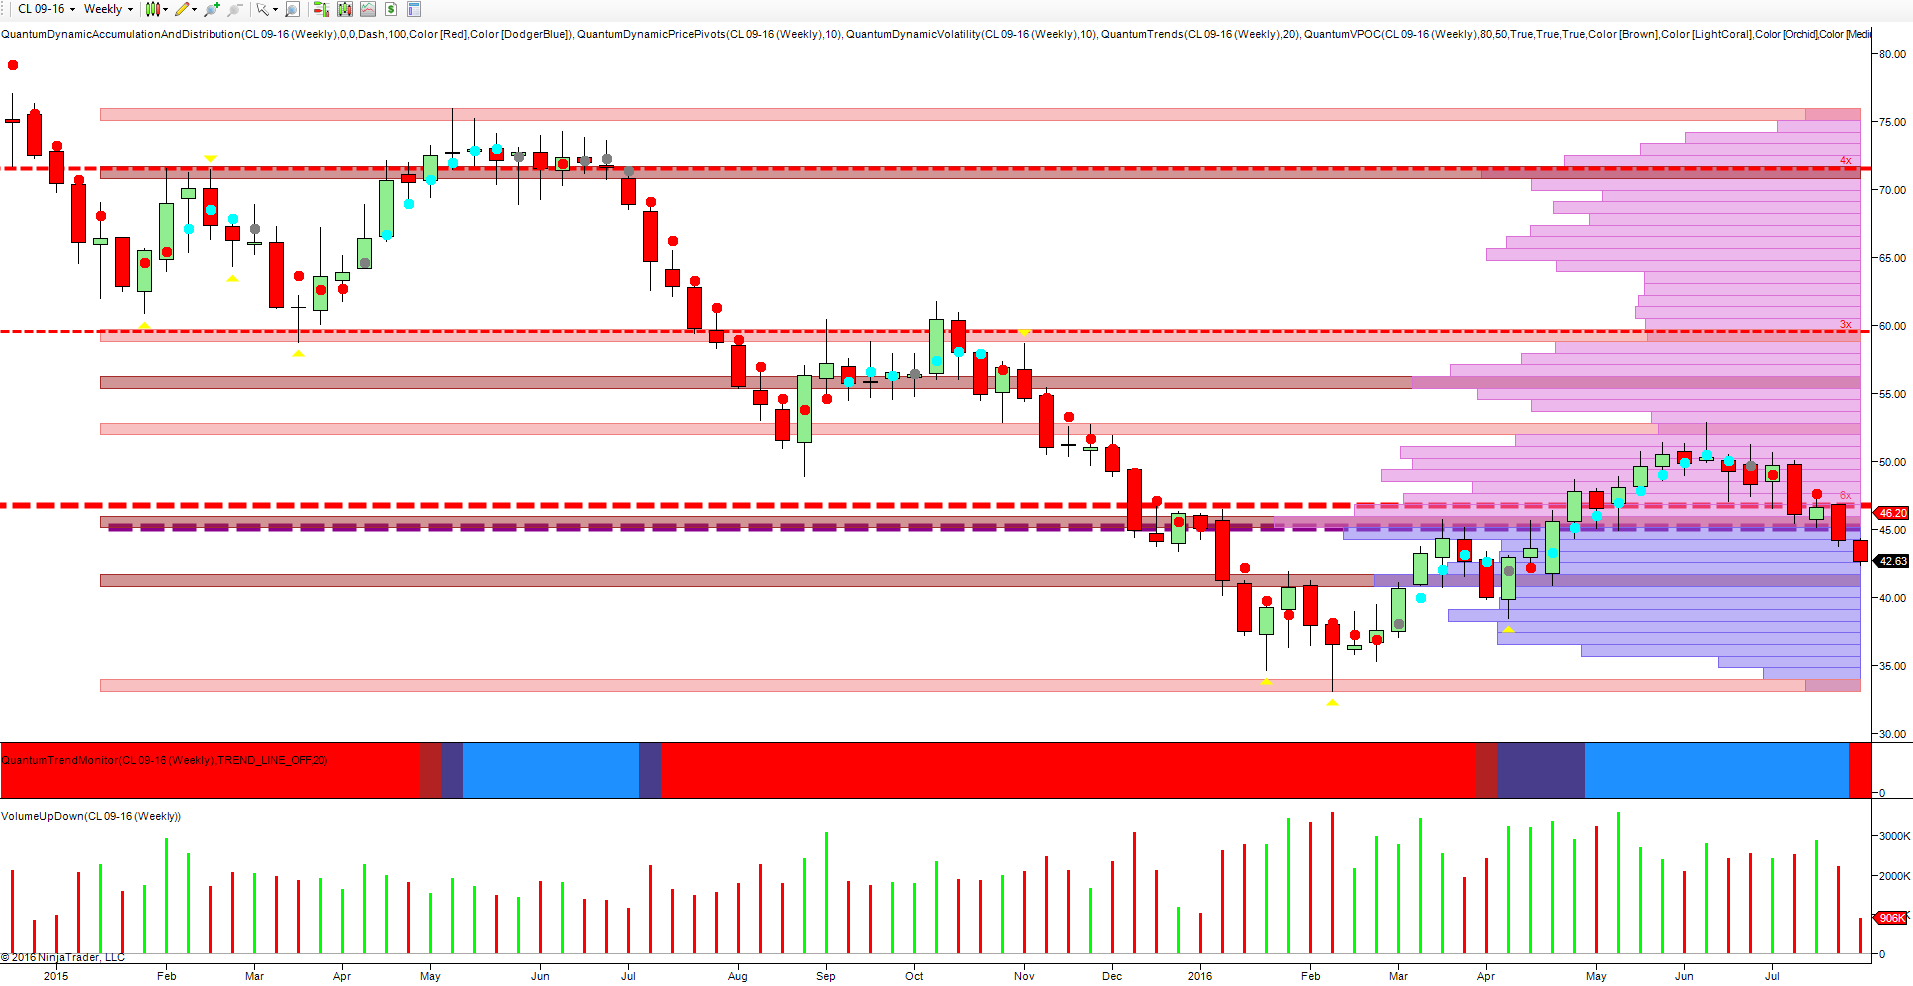
The weekly chart also confirms the current bearish sentiment with the rally of May on falling volume signalling weakness ahead, duly confirmed in the first week in June with the upthrust candle on high volume, and with this week’s price action breaking below the volume point of control in the $45 per barrel area, as denoted with the purple dashed line. Below is a high volume node at $41 per barrel and if this is breached, then $37 per barrel would be confirmed as the next likely pause point. The trend monitor indicator has also transitioned to bright red in this time frame.

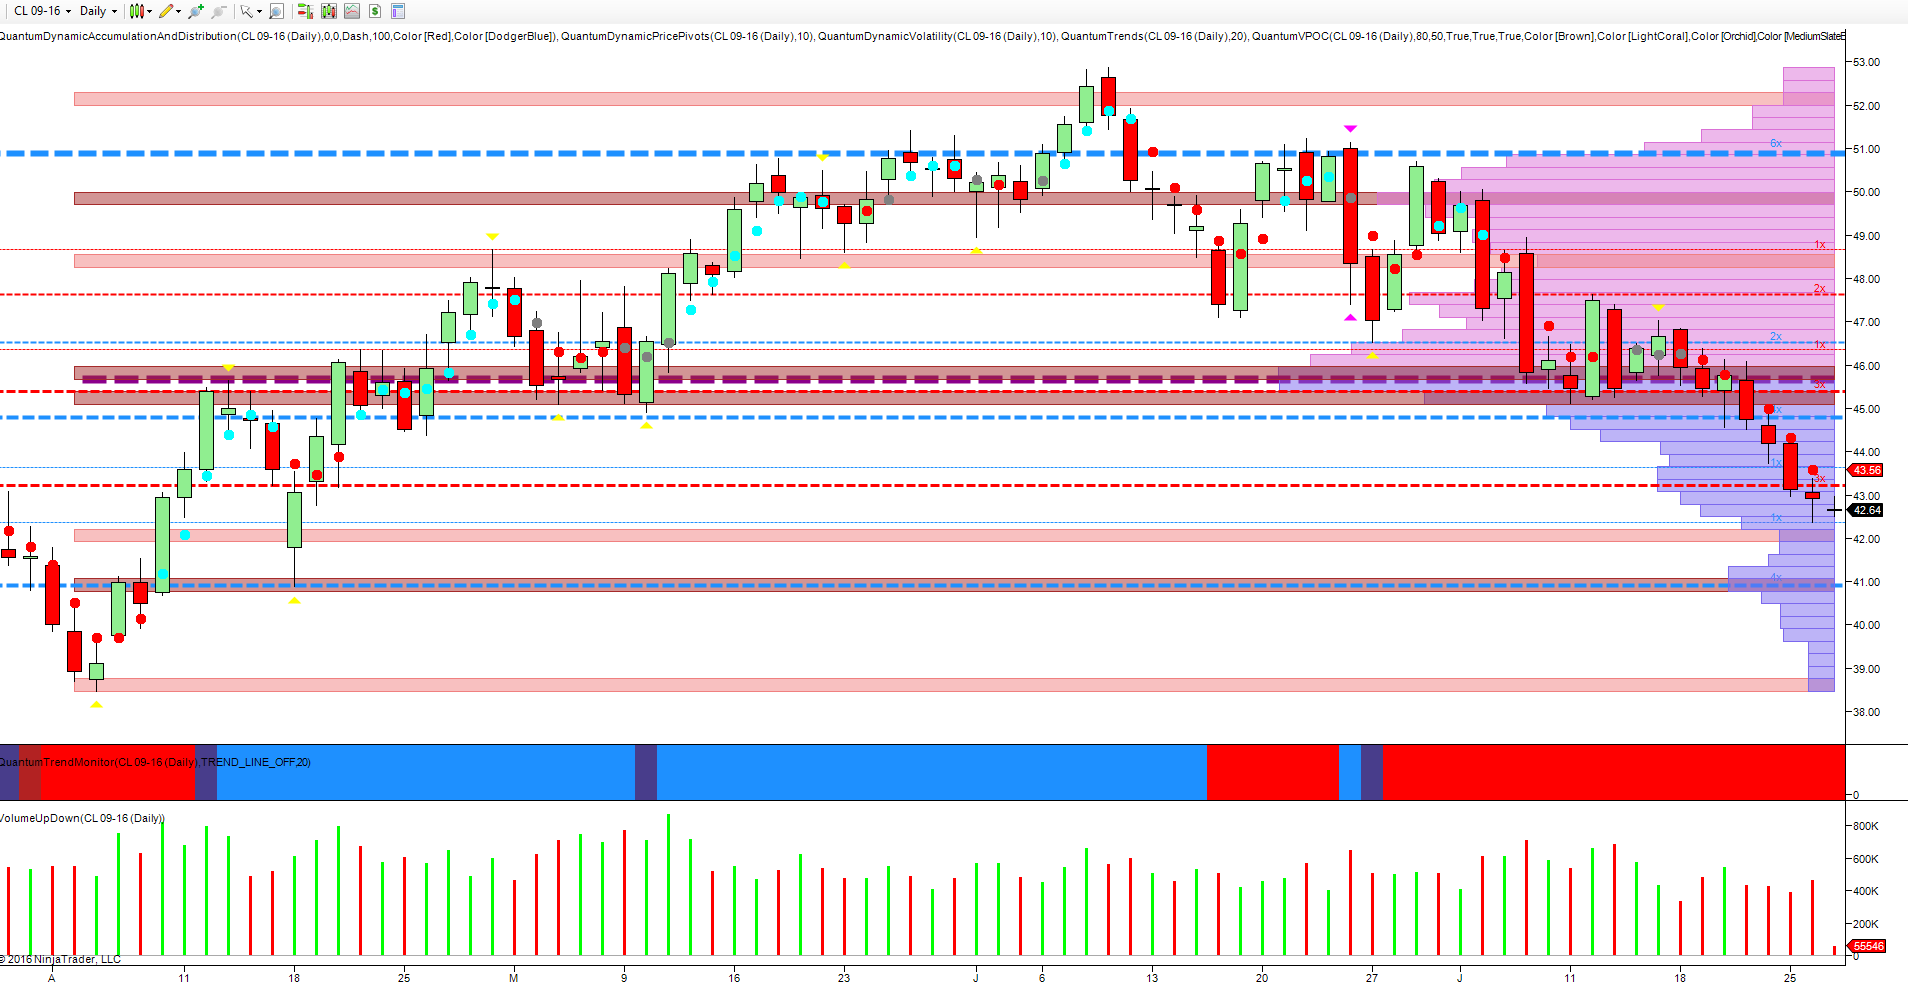
Finally to the daily chart, and following the break away from the volume point of control in the $45.70 per barrel area, bearish momentum has increased, as the market now approaches the low volume node at $42 per barrel. The next area of support then awaits in the $41 per barrel area, where a high volume node coupled with a strong area of accumulation, as denoted with the blue dotted line, may provide some temporary respite for crude oil in the short term.
