
Thanks to lingering worries about oversupply, oil saw the worst first-half performance since 1998, tumbling 14%. This is especially true as optimism surrounding the historic OPEC output cut deal was overshadowed by surging production in the U.S., Libya and Nigeria as well as high global inventories leading to a decline in oil price (read: Profit from Bearish Oil Market with These ETFs).
The current indicators have been bearish given the barrage of negative data flow that point to a period of protracted lower oil prices. U.S. is producing oil near its highest level of 9.3 million barrels per day since August 2015. The Energy Information Administration (EIA) expects U.S. oil production to increase to 10 million barrels a day next year, breaking the 1970 record of 9.6 million barrels a day. Most of the production growth is expected to come from increased drilling activity in U.S. tight oil basins especially those located in Texas as drillers are taking full advantage of the OPEC deal to limit output in a bid to shrink global oversupply.
Libya is currently pumping 885,000 barrels a day per week, roughly three times the year-ago production and aims to raise production to 1 million barrels a day by the end of July. Meanwhile, exports from Nigeria are expected to exceed 2 million barrels per day in August — the highest in 17 months — as the country is on track to recover fully from militant attacks that crippled production in 2016.
Given the increased supply from these three countries, most analysts expect oil price to drop further.
Oil Refining Thriving
Given the unfavorable fundamentals and a bleak oil outlook, almost every corner of the energy segment is suffering except oil refining, which is negatively correlated with the price of oil. This is because the players in this industry use oil as an input for processing refined petroleum products like gasoline. Hence, lower oil prices are boosting margins for refiners, leading to healthy stock prices (read: Oil ETFs: Short-Term Bane, Long-Term Boon).
This trend is likely to continue if crude prices (input costs) remain lower or continue to fall further, leading to higher spreads. Spread is the difference in price between a barrel of oil and a barrel of refined product like gasoline, diesel, or jet fuel. As a result, the higher the spread, the more the profits will be for oil refiners.
That said, as long as the spread remains stable at the current levels, refiners are expected to outperform the rest of the energy sector. Investors could tap the rising opportunity in this niche segment with the pure play ETF VanEck Vectors Oil Refiners ETF CRAK. It is a one-stop shop for investors to play the oil refining market.
CRAK in Focus
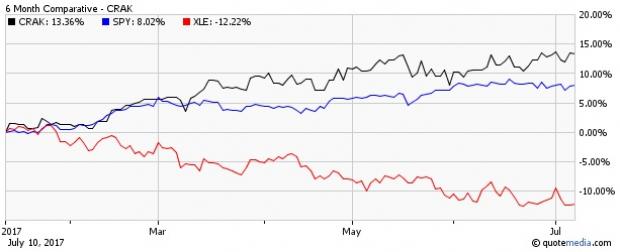
CRAK looks to follow the MVIS Global Oil Refiners Index. The benchmark measures the performance of the largest and most liquid companies in the global oil refining segment, which includes gasoline, diesel, jet fuel, fuel oil, naphtha and other petrochemicals. The product has accumulated $4.6 million in its asset base within two years of its inception. It has returned 12.4% so far this year, outperforming not only the energy sector but also the broad market fund (AX:SPY) , which has gained 9.4% (read: Energy ETF (NYSE:XLE) Hits New 52-Week High).
Any Downside Risk?
The fund is heavily concentrated on the top 10 firms with huge allocations to Phillips 66 (NYSE:PSX) , Reliance Industries and Valero Energy (NYSE:VLO) that collectively make up for one-fourth of the portfolio. This increases company-specific risk and suggests that the top firms dominate the fund’s returns. Additionally, the oil refining and marketing industry has a Zacks rank in the bottom 20%, suggesting some pain in the coming months.
Further, the fund is not a pure American play and hence exposed to currency risk. More than half the portfolio offers international exposure, namely Japan, India, Austria, Poland, Finland, Thailand, Portugal, South Korea, Taiwan and many others (see: all the energy ETFs here).
Investors should note that it is a relatively high cost choice in the energy space. It charges a bit higher fee of 59 bps compared with the expense ratio of 0.15% for the broad sector fund – Energy Select Sector SPDR XLE. The fund also has a wide bid/ask spread as it trades in a paltry average daily volume of about 1,000 shares, which increases its total cost of trading beyond the expense ratio.
Bottom Line
Given the encouraging outlook for the oil refiners, CRAK could prove to be the lone star in the energy space in a plunging oil price environment.
Want key ETF info delivered straight to your inbox?
Zacks’ free Fund Newsletter will brief you on top news and analysis, as well as top-performing ETFs, each week. Get it free >>
SPDR-SP 500 TR (SPY (NYSE:SPY)): ETF Research Reports
SPDR-EGY SELS (XLE): ETF Research Reports
VANECK-OIL REF (CRAK): ETF Research Reports
Valero Energy Corporation (VLO): Free Stock Analysis Report
Phillips 66 (PSX): Free Stock Analysis Report
Original post
Zacks Investment Research
- English (UK)
- English (India)
- English (Canada)
- English (Australia)
- English (South Africa)
- English (Philippines)
- English (Nigeria)
- Deutsch
- Español (España)
- Español (México)
- Français
- Italiano
- Nederlands
- Português (Portugal)
- Polski
- Português (Brasil)
- Русский
- Türkçe
- العربية
- Ελληνικά
- Svenska
- Suomi
- עברית
- 日本語
- 한국어
- 简体中文
- 繁體中文
- Bahasa Indonesia
- Bahasa Melayu
- ไทย
- Tiếng Việt
- हिंदी
Oil Refiner ETF (CRAK): A Star Pick Amid Weak Oil Price
Published 07/10/2017, 10:22 PM
Updated 10/23/2024, 11:45 AM
Oil Refiner ETF (CRAK): A Star Pick Amid Weak Oil Price
Latest comments
Loading next article…
Install Our App
Risk Disclosure: Trading in financial instruments and/or cryptocurrencies involves high risks including the risk of losing some, or all, of your investment amount, and may not be suitable for all investors. Prices of cryptocurrencies are extremely volatile and may be affected by external factors such as financial, regulatory or political events. Trading on margin increases the financial risks.
Before deciding to trade in financial instrument or cryptocurrencies you should be fully informed of the risks and costs associated with trading the financial markets, carefully consider your investment objectives, level of experience, and risk appetite, and seek professional advice where needed.
Fusion Media would like to remind you that the data contained in this website is not necessarily real-time nor accurate. The data and prices on the website are not necessarily provided by any market or exchange, but may be provided by market makers, and so prices may not be accurate and may differ from the actual price at any given market, meaning prices are indicative and not appropriate for trading purposes. Fusion Media and any provider of the data contained in this website will not accept liability for any loss or damage as a result of your trading, or your reliance on the information contained within this website.
It is prohibited to use, store, reproduce, display, modify, transmit or distribute the data contained in this website without the explicit prior written permission of Fusion Media and/or the data provider. All intellectual property rights are reserved by the providers and/or the exchange providing the data contained in this website.
Fusion Media may be compensated by the advertisers that appear on the website, based on your interaction with the advertisements or advertisers.
© 2007-2025 - Fusion Media Limited. All Rights Reserved.