Recent releases from the International Energy Agency tell of moderating growth rate of the global demand for oil – which was based on lower economic growth projections. And promises of “fracking” to boost oil supply are bouncing around cyberspace. Images of supply and demand curves flash in one's mind.
Yet, the cost of oil today has little to do with supply versus demand – but is more about marginal cost of supply and producers ability to manipulate supply. Peak oil and anti-Obama rhetoric notwithstanding, oil production in the USA has been growing (see graph below).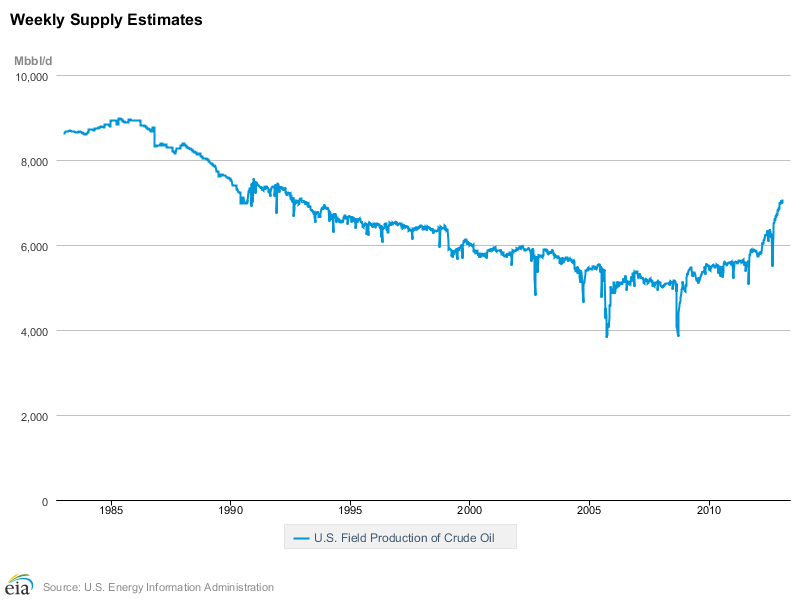
There has been much hope for moderation of oil prices triggered by additional supply of crude being brought by fracking. The BBC reported:
The oil and gas industry in north-east Scotland has been warned it needs to adjust to the challenges and opportunities from “fracking” and other unconventional methods of drilling. They have already radically re-shaped the North American energy market. If deployed in other parts of the world, business consultancy Pricewaterhouse Coopers (PwC) said it could depress the price of oil. It said it could be up to 40% below the level it would otherwise reach by 2035.
Some believe fracking can make the USA energy independent. Roughly, that means the USA would double its production, freeing 6 billion barrels of previously imported oil in the global market. This will happen over a number of years – while the global demand is growing roughly at 0.9 million barrels per day each year. My belief is that fracking rate of growth is unlikely to grow faster than the growth rate of global demand for oil.
Most analysts make the mistake in believing that the USA lives in a vacuum. If it were possible to build a wall around the USA, it is likely the marginal costs (the all in cost for producing a barrel of oil) would be in the $60 per barrel range. [Note that I have read reports that the marginal costs for oil fracking in North Dakota is $40 per barrel.] The point here is that if the USA could isolate itself and if the production of oil could exceed demand, the price of a barrel of oil could be up to 40% lower.
But globalization equalizes commodity prices around the world, except for distribution inefficiencies such as are currently seen for natural gas. [hat tip for the below graphic to Cambridge Energy Research Associates ("CERA") via Safehaven]. 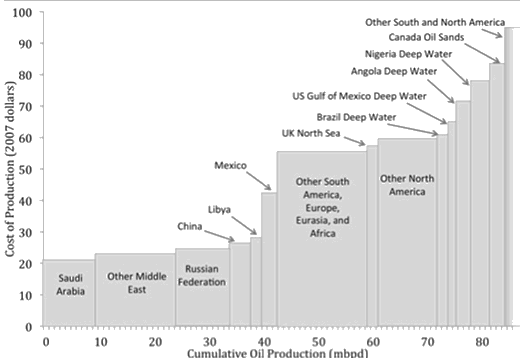
There is “peak oil” depending on the price. At $80 per barrel, over 10% of the world’s oil production is unprofitable to lift, and at $60 per barrel, 20% of the global supply of oil is too expensive to lift. Currently the average price per barrel averaging West Texas and Brent is running over $100 per barrel. It is fairly easy for OPEC and their associated members to withhold enough supply to keep oil prices from falling – as prices are influenced by the highest marginal rates.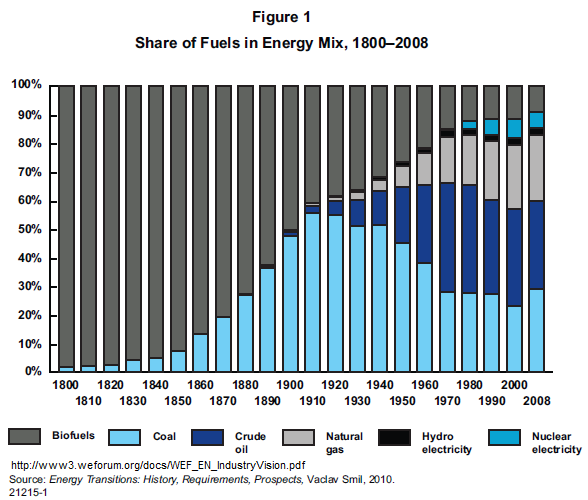
A forecast for the future price of oil must take into consideration forces that are unforecastable. All forecasts for oil prices are worthless.
- No ability to forecast oil producers actions;
- No ability to understand the changing mix between oil and other energy sources;
- No ability to forecast USA government actions on oil producers including taxation, regulation;
- No ability to foresee supply disruptions;
- No ability to really gauge the global economy.
And based on the short term trends in play – a major and permanent drop in demand or an increase in supply – this is not in the cards.
Other Economic News this Week:
The Econintersect economic forecast for February 2013 continues to show weak growth. The underlying dynamics have a whiff of improvement – but the zinger in the data was a supply chain contraction. However all the recession markers have evaporated, and one of our alternate methods to validate our forecast remains recessionary (but still only slightly so). Basically, we are saying that not enough products (crude, intermediate, and finished) were moved for sales or manufacture in February.
ECRI now believes a recession began in July 2012. ECRI first stated in September 2011 a recession was coming . The size and depth is unknown. The ECRI WLI growth index value has been weakly in positive territory for over three months – but in a noticeable improvement trend. The index is indicating the economy six month from today will be slightly better than it is today.
Current ECRI WLI Growth Index

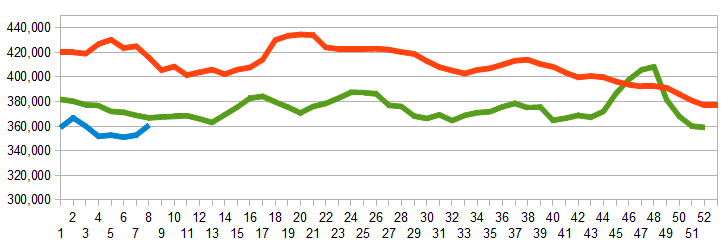
Initial unemployment claims rose from 341,000 (reported last week) to 362,000 this week. Historically, claims exceeding 400,000 per week usually occur when employment gains are less than the workforce growth, resulting in an increasing unemployment rate (background here and here).
The real gauge – the 4 week moving average – rose from 352,500 (reported last week) to 360,750. Because of the noise (week-to-week movements from abnormal events AND the backward revisions to previous weeks releases), the 4-week average remains the reliable gauge.
Weekly Initial Unemployment Claims – 4 Week Average – Seasonally Adjusted – 2011 (red line), 2012 (green line), 2013 (blue line)
Bankruptcies this Week: RDA Holding, parent company of The Reader’s Digest Association
Data released this week which contained economically intuitive components(forward looking) were:
- Rail movements are somewhat improving looking at the 4 week average, but longer term trends are still declining.
- The FOMC meeting minutes showing confusion over the effects of quantitative easing, as well as timing. Although this is not necessarily intuitive – it has caused many to re-evaluate the future and become less optimistic.
Weekly Economic Release Scorecard:
Click here to view the scorecard table below with active hyperlinks.
