Last week I spotted a very interesting chart that Gregor MacDonald tweeted which showed world oil production over recent years excluding the USA. The chart was pretty flat and that got me wondering about the extent to which the world has come to depend upon Light Tight Oil in the USA and, for that matter, Steam Assisted Gravity Drainage (SAGD or oil sands) projects in Canada.
So I went back to the font of all knowledge, the BP (LONDON:BP) statistical review of world energy, and reconstructed the plot with my own little variations on it. For one thing, I added in OPEC's spare capacity, as what I was really interested in seeing was just how much capacity the world had to produce oil. Figures on unused capacity are hard to come by, but the EIA do publish a series of estimates of OPEC spare capacity and it is pretty reasonable to expect that just about everyone else is pumping flat out. Then I thought I would add Canada and the USA together, LTO and SAGD are different in many ways, but they both grew in response to higher oil prices.
Finally, I thought I would compare the total world production capacity to BP's figures for oil consumption (less biofuels) to see how the trends had moved. BP do give a pretty healthy warning on their work that supply does not equal consumption, but the details of why that is so (other than stock movements) elude me.
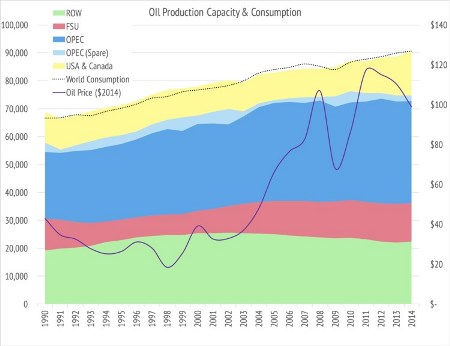
No matter. Here is the aggregated picture of world oil production capacity vs world oil demand from 1990 onwards with the annual average oil price in 2014 dollars added on for good measure.

Data BP Statistical Review of World Energy & EIA
You can see two things on this chart: the first is that when capacity exceeds demand, prices are low (and vice versa); the second is that, since about 2005, despite the oil price being rather high, outside North America the world has struggled to add any oil production capacity at all. In fact, since 2010 oil production capacity outside North America has been in decline. If it weren't for the USA and Canada, where production growth has been driven by LTO & SAGD, we would have been in a right pickle.
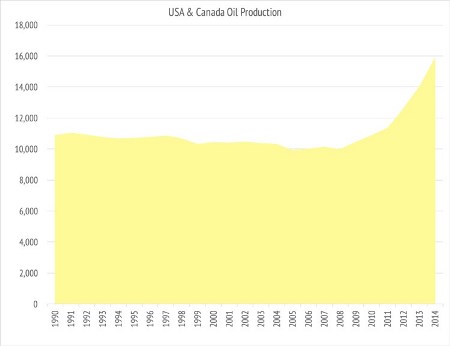
Here is a closer look at that growth in capacity in North America. It is very dramatic, but what you don't see on this chart is that by the end of this year that growth will have halted and that demand will once again exceed capacity.

Data BP Statistical Review of World Energy
In the short term, the oil market is in the doldrums and projects are being delayed or cancelled left, right and center. That will mean that, outside North America, oil production capacity will decline even faster and with the growth knocked out of the shale producers and SAGD projects being put on the back burner, it is only a matter of months before demand starts to exceed world oil production capacity again. A nasty recession might put a dent in demand growth and turn those months into quarters, but eventually capacity will wane, demand will wax and the oil price will climb once again.
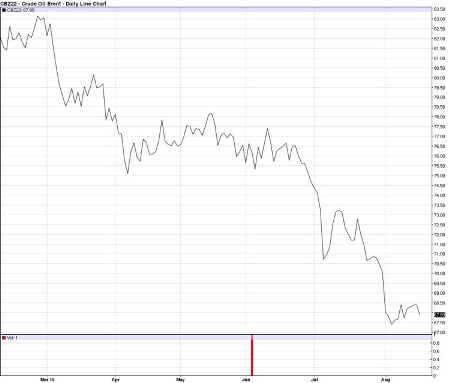
In fact if traders looked hard at these charts they might wonder if the continued weakness in the 2022 Brent oil future was a tad overdone. For this time, I think the price response might be even stronger and more sustained than before.

