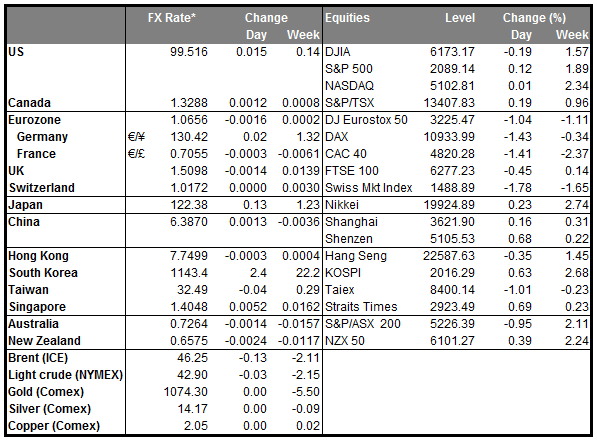
• Oil prices edge higher partly due to US blizzard Oil prices and Asian stock markets began the week on a stronger note, extending Friday’s gains, after a blizzard paralyzed much of the US east coast during the weekend. The rise in oil prices came as a result of investors speculating a rise in demand for heating oil and natural gas in the near future. Prices got an additional boost from the supply side last week, after the reported number of US active oil rigs dropped by 5 to 510, extending a recent streak of declines. If the cold continues in the following days, oil prices may gain even further, mainly due to a possible increase in demand. However, even if the oil prices remain supported in the event of a prolonged period of cold weather and oil-related currencies like CAD and NOK gain a bit further, the advance could be short-lived as the overall trend of oil is still a downtrend. We still believe that the structural conditions surrounding the oil sector remain unchanged. As a secondary effect coming from the cold weather, the US growth could slow in the first quarter of the year as a decline in consumer spending and a fall in retail sales could impact the country’s performance. On top of that, if federal government offices along with state and local government offices remain closed, this could interrupt the usual operations and further deteriorate growth in Q1. If the country remains paralyzed for an extended period of time, this could prove USD-negative.
• Today’s highlights: During the European day, the German Ifo survey for January is due to be released. The forecast is for both the business climate and expectations indices to decline a bit. This is somewhat in line with the ZEW survey for the same month, which showed that business expectations for the German economy have been affected by the slowdown in China and other EM economies. Given the latest soft data out from China, the expectations index could continue to decline in coming months, perhaps until China and the other EM economies begin to recover, or at least stabilize. Thus, we expect that the decline in the Ifo indices could add some selling pressure to the common currency, at least at the release.
• From the US, the Dallas Fed manufacturing activity index for January is coming out, though no forecast is available.
• We have only one speaker scheduled on Monday’s agenda: ECB President Mario Draghi speaks.
• As for the rest of the week, the highlight will be on Wednesday when two central banks hold their policy meetings: the Fed and the RBNZ. At their last meeting, Fed officials unanimously voted to increase the target range of the federal funds rate by 25bps. In the statement, the FOMC stressed that the path of future policy will be gradual and determined by incoming data from the labour market and signs of inflationary pressures. They noted that the labour market has improved further, which they expected to continue, and that inflation has been running below target partly due to declines in energy prices. Since then, incoming data have shown further improvement, with December’s NFP figure surging and the CPI for the same month accelerating, albeit below expectations. Despite these considerable improvements, we expect the Fed to hold its fire at this meeting. Firstly, while the NFP number rose in December, the hourly earnings growth rate remained flat. This may indicate that near-term inflation pressures could remain somewhat subdued. We expect the FOMC to see at least inflationary pressure moving higher before raising rates again. The renewed fall in oil prices since the latest meeting, along with the flat wage growth may put downside risks to the Fed’s inflation outlook. Additionally, the global outlook has deteriorated considerably since December, and while Fed speakers have stated that this does not substantially affect the US economy we could see a shift in the tone of the statement that shows some concerns about the recent developments.
• On Tuesday, we have no major events or indicators due to be released.
• On Wednesday, besides the Fed meeting, the Reserve Bank of New Zealand will also meet to decide on monetary policy. After a reduction of the official cash rate by 25bps at its last meeting, we expect the Bank to remain on hold, despite the close to zero inflation and the slowdown in China. Instead of a rate cut, we expect the Bank to push back the date by which it expects to meet its target, while leaving the door open for additional easing should the risks around the inflation outlook increase further.
• On Thursday, the preliminary UK GDP for Q4 is due to be released. The forecast is for the growth to have accelerated to +0.5% qoq from +0.4% qoq. Under normal circumstances this should offset some of the recent soft data and bring forward expectations for a BoE rate hike. Nevertheless, given the recent comments by BoE Governor Carney that now it’s not the time to raise rates, and having in mind the uncertainty surrounding the “Brexit” referendum, we believe that the Bank could be reluctant to hike until there is greater clarity on Britain’s position within Europe. In Germany, the preliminary CPI rate for January is expected to accelerate. If the forecast is met, this could increase the likelihood that Eurozone’s CPI to be released on Friday could rise as well. From the US, we get durable goods orders for December. Both the headline and core figures are forecast to fall slightly after stagnating the previous month. The expected fall in durable goods could ease some of the dollar’s recent gains.
• On Friday, during the Asian morning, the Bank of Japan will end its two-day monetary policy meeting. At its latest meeting, the BoJ launched additional measures in a surprise move, aimed at encouraging corporate spending and hiring. Through these measures the Bank intends to stimulate wage growth in the private sector and boost inflation over the longer term. We expect the BoJ to leave policy unchanged at this meeting and Gov. Kuroda to maintain his optimistic view that the underlying trend in prices is improving. From Eurozone, the preliminary CPI for December is expected to show an acceleration from the previous month. Although this contradicts ECB President Draghi’s recent statement that inflation is expected to run very low or negative in coming months, as inflation has been stuck near the zero bound for a long time, any acceleration could support the common currency.
• In the US, the initial estimates of Q4 GDP growth and core PCE deflator are due to be released. Both are expected to have slowed from the previous quarter.
The Market
EUR/USD rebounds once again from just below 1.0800
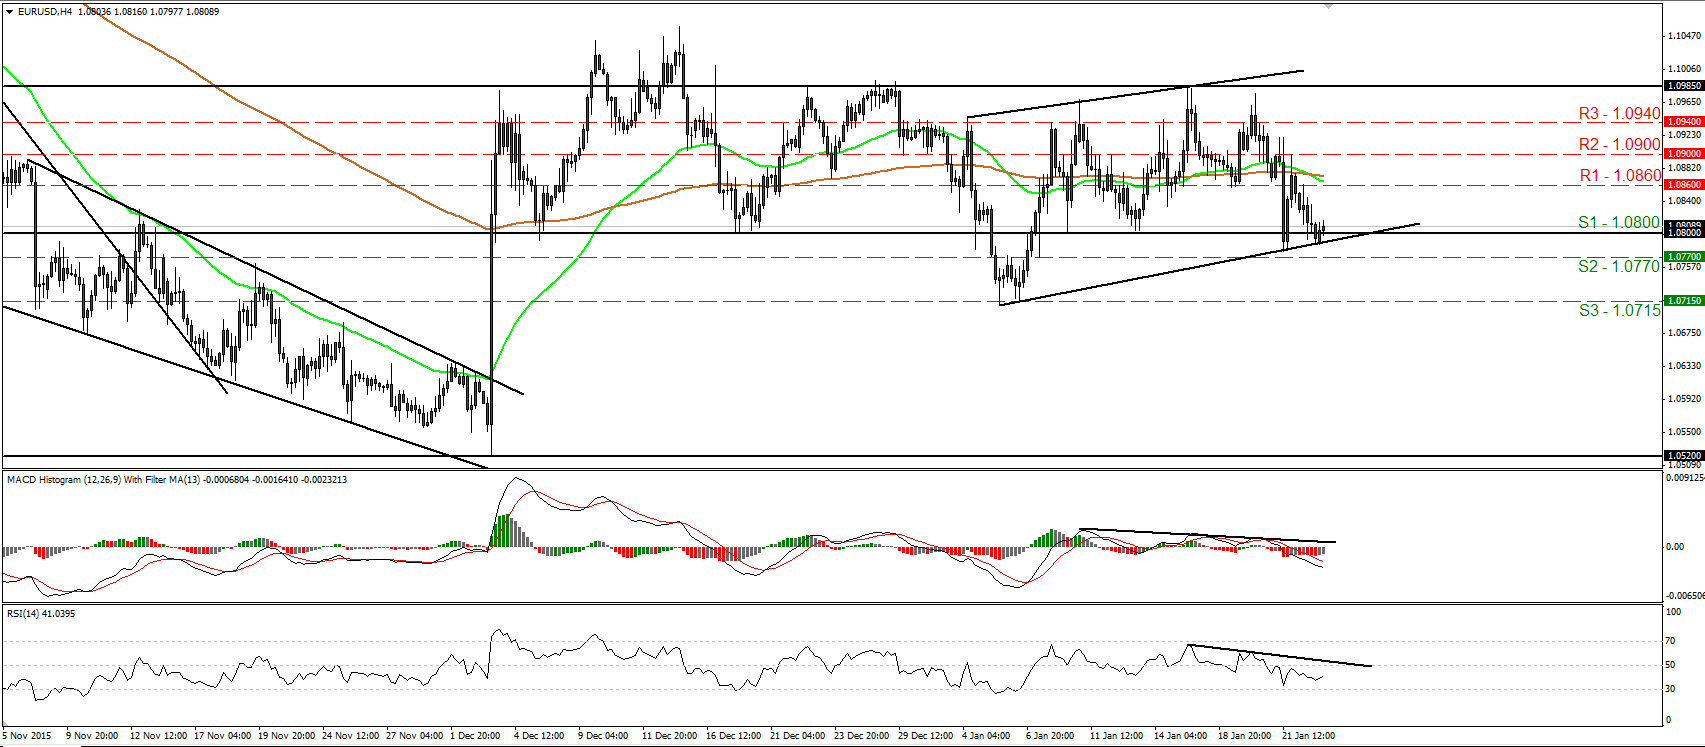
• EUR/USD tumbled on Friday and hit once again support slightly below the key hurdle of 1.0800 (S1), near the upside support line taken from the low of the 5th of January. Then the rate rebounded back above the 1.0800 (S1) obstacle. As long as the pair is trading between the 1.0800 (S1) line and the resistance zone of 1.0985, I would still consider the short-term trend to be to the sideways. I would like to see a new attempt below 1.0800 (S1) before getting confident that the outlook has turned negative. For now, I see the possibility for the current rebound to continue for a while, perhaps for another test at the 1.0860 (R1) resistance zone. This is also supported by our short-term oscillators. The RSI has turned up again, while the MACD, although negative, shows signs of bottoming. In the bigger picture, I will hold the view that as long as the pair is trading above the key support zone of 1.0800 (S1), the medium-term picture stays flat as well.
• Support: 1.0800 (S1), 1.0770 (S2), 1.0715 (S3)
• Resistance: 1.0860 (R1), 1.0900 (R2), 1.0940 (R3)
GBP/JPY rallies above 169.00
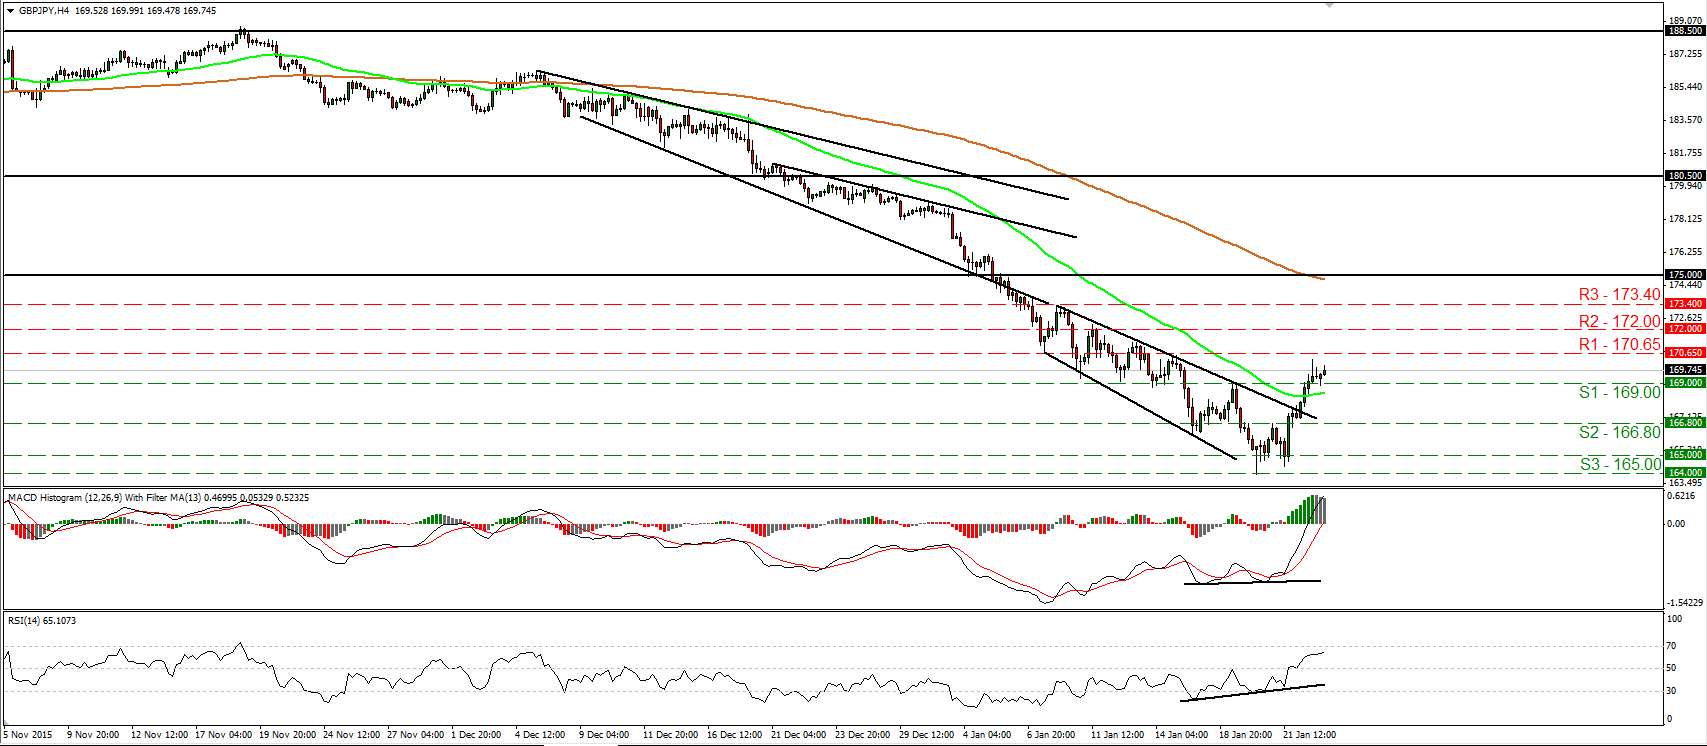
• GBP/JPY continued trading higher on Friday after it broke above the downside resistance line drawn from the peak of the 8th of January. The rate emerged above the resistance (now turned into support) line of 169.00 (S1) and now looks to be headed for a test at the 170.65 (R1) barrier. A clear break above that level is likely to signal the continuation of the rally and is possible to aim for the 172.00 (R2) zone. Looking at our short-term oscillators, I see that the recent rebound confirmed the positive divergence between both the indicators and the price action. What is more, the RSI edged higher and now looks able to challenge its 70 line, while the MACD stands above both its zero and trigger lines, and points north. Zooming out to the daily chart, I see that on the 21st of December the rate fell below the 180.50 key hurdle, which is the lower bound of the wide range the pair had been trading since the 25th of August. Bearing that in mind, I would still consider the medium-term picture to be negative and I would treat the recent advance, or any extensions of it, as a corrective phase, at least for now.
• Support: 169.00 (S1), 166.80 (S2), 165.00 (S3)
• Resistance: 170.65 (R1), 172.00 (R2), 173.40 (R3)
AUD/USD completes a double bottom
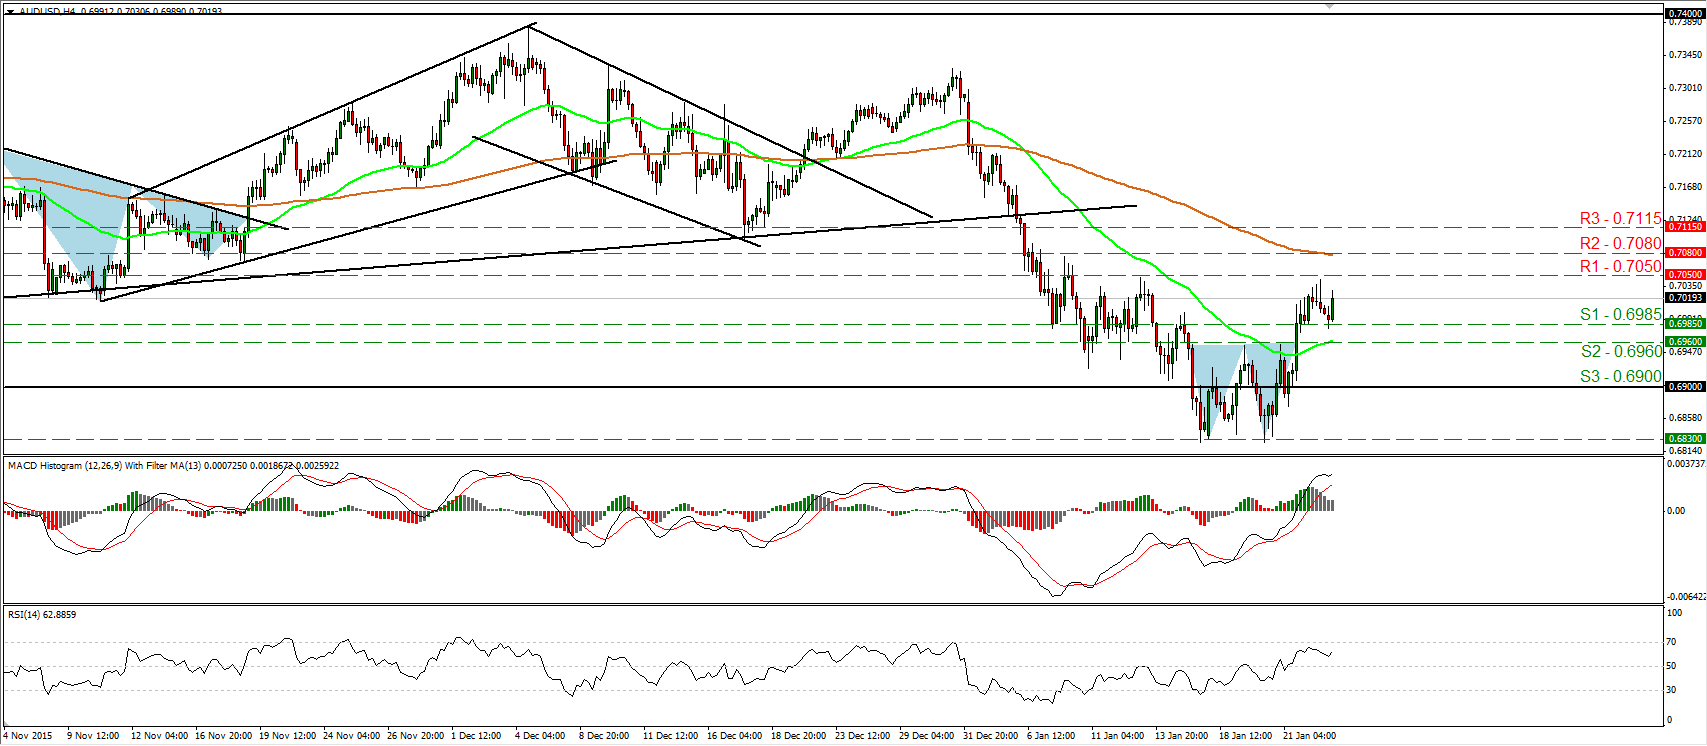
• AUD/USD completed a double bottom formation on Thursday after it broke above the 0.6960 (S2) barrier. The advance continued and on Friday it hit resistance marginally below the 0.7050 (R1) line before retreating. Today, during the early European morning, the rate hit support near the 0.6985 (S1) barrier and rebounded somewhat. In my view, following the completion of the double bottom, the short-term picture has turned positive. As a result, I would expect the bulls to aim for another test near the 0.7050 (R1) hurdle, where an upside break is possible to initially aim for the next resistance of 0.7080 (R2). Shifting my attention to our short-term momentum studies, I see that the RSI has turned up again and could be headed for a test near its 70 line, while the MACD, already above both its zero and trigger lines, has also turned north. As for the bigger picture, the rate is back above the 0.6900 (S3) line, which is the lower bound of the sideways range the pair has been trading since mid-July. Therefore, although I would expect some further near-term advances, I would maintain a neutral stance as far as the longer-term picture is concerned.
• Support: 0.6985 (S1), 0.6960 (S2), 0.6900 (S3)
• Resistance: 0.7050 (R1), 0.7080 (R2), 0.7115 (R3)
WTI surges above 32.00
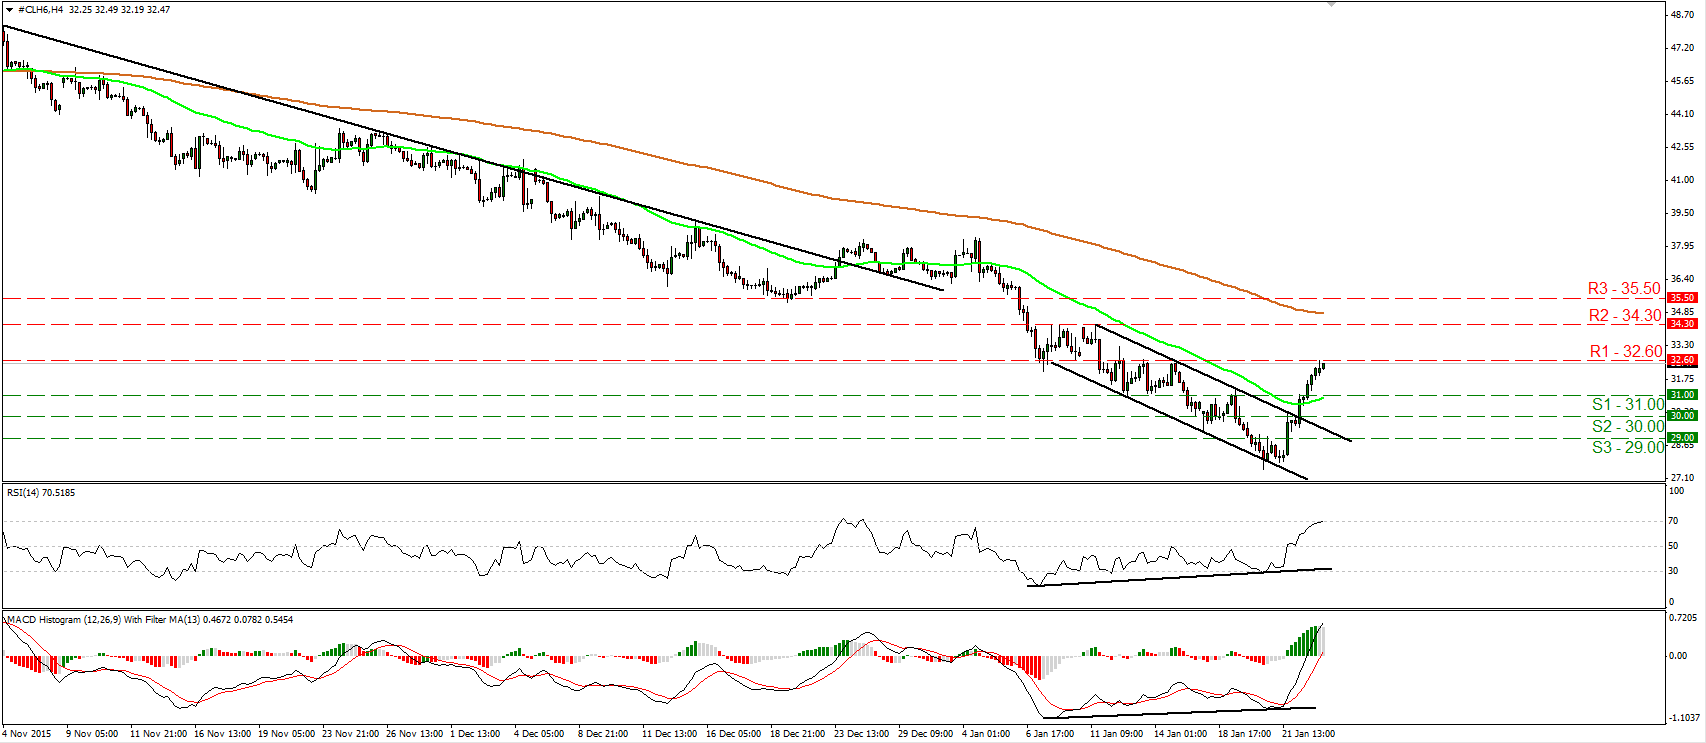
• WTI surged on Friday, breaking above the upper bound of a short-term downside channel that had been containing the price action since the 7th of January. During the early European morning Monday, the price is testing the 32.60 (R1) resistance hurdle, where a clear break is possible to carry more bullish extensions, perhaps towards our next resistance of 34.30 (R2). Our short-term momentum studies detect upside momentum and magnify the case that the price is possible to continue trading higher, at least for a while. The RSI moved higher and just poked its nose above its 70 line, while the MACD stands above both its zero and signal lines, pointing north. On the daily chart, I see that WTI has been printing lower peaks and lower troughs since the 9th of October. As a result, I would consider the longer-term picture to stay negative, and I would treat the recent recovery as a corrective move at the moment.
• Support: 31.00 (S1), 30.00 (S2), 29.00 (S3)
• Resistance: 32.60 (R1), 34.30 (R2), 35.50 (R3)
Gold rebounds from 1095
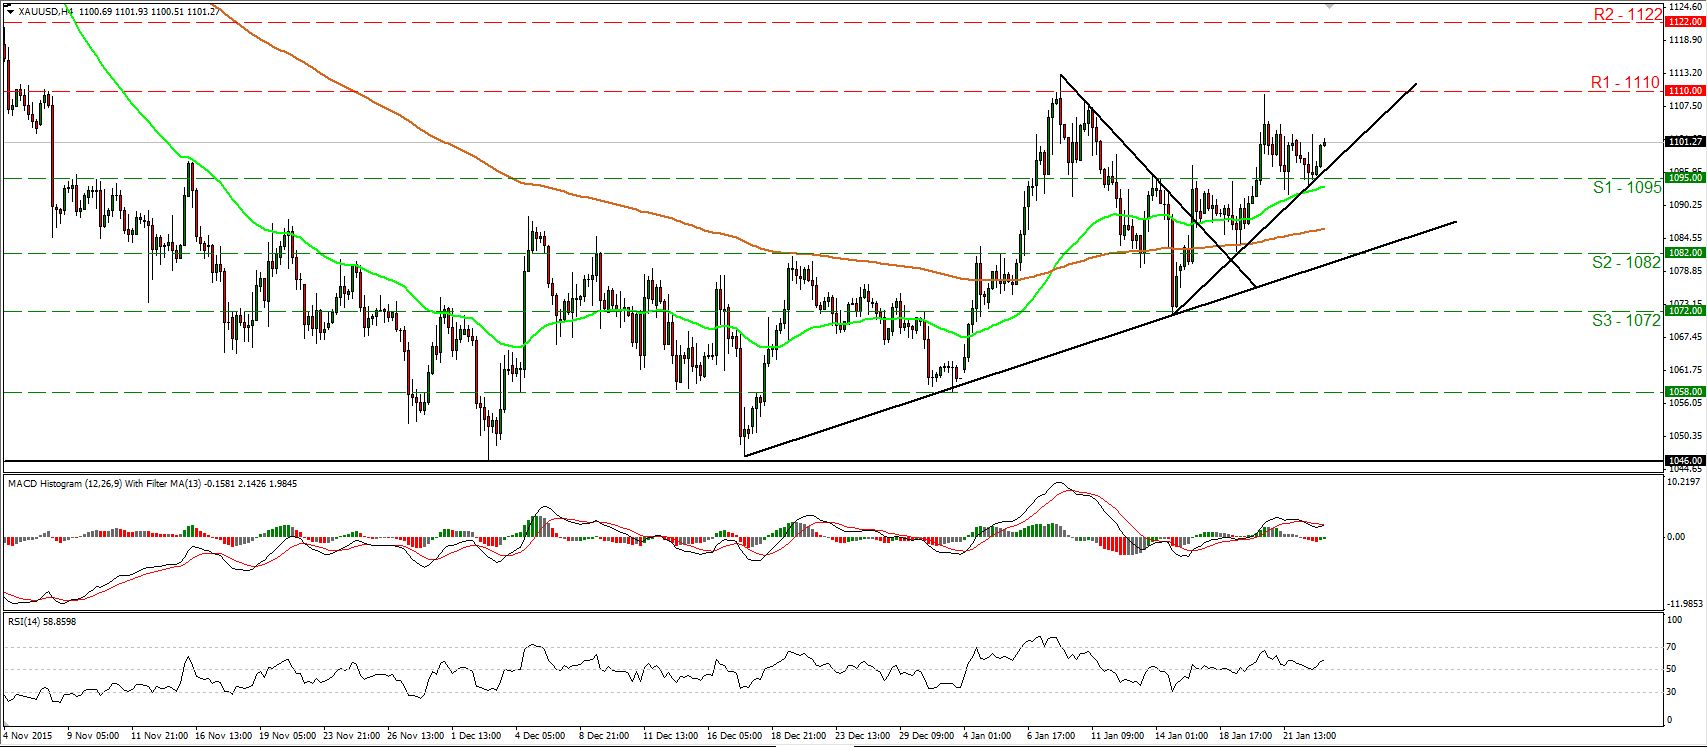
• Gold traded lower on Friday, but hit support near the 1095 (S1) line and then it rebounded. Bearing in mind that the price is trading above the downtrend line taken from the peak of the 8th of January and above the uptrend line drawn from the low of the 17th of December, I would consider the short-term outlook to stay positive. I believe that buyers will aim for another test near 1110 (R1), where a clear break is likely to see scope for extensions towards our next obstacle of 1122 (R2). Our short-term oscillators detect positive momentum and corroborate my view. The RSI turned up after it hit support at its 50 line, while the MACD, already positive, has turned up and looks ready to cross above its trigger line. As for the broader trend, the metal formed a higher high on the 8th of January, near 1110 (R1). Then it printed a higher low on the 14th of the month. As a result, I still see a cautiously positive medium-term outlook.
• Support: 1095 (S1), 1082 (S2), 1072 (S3)
• Resistance: 1110 (R1), 1122 (R2), 1132 (R3)


