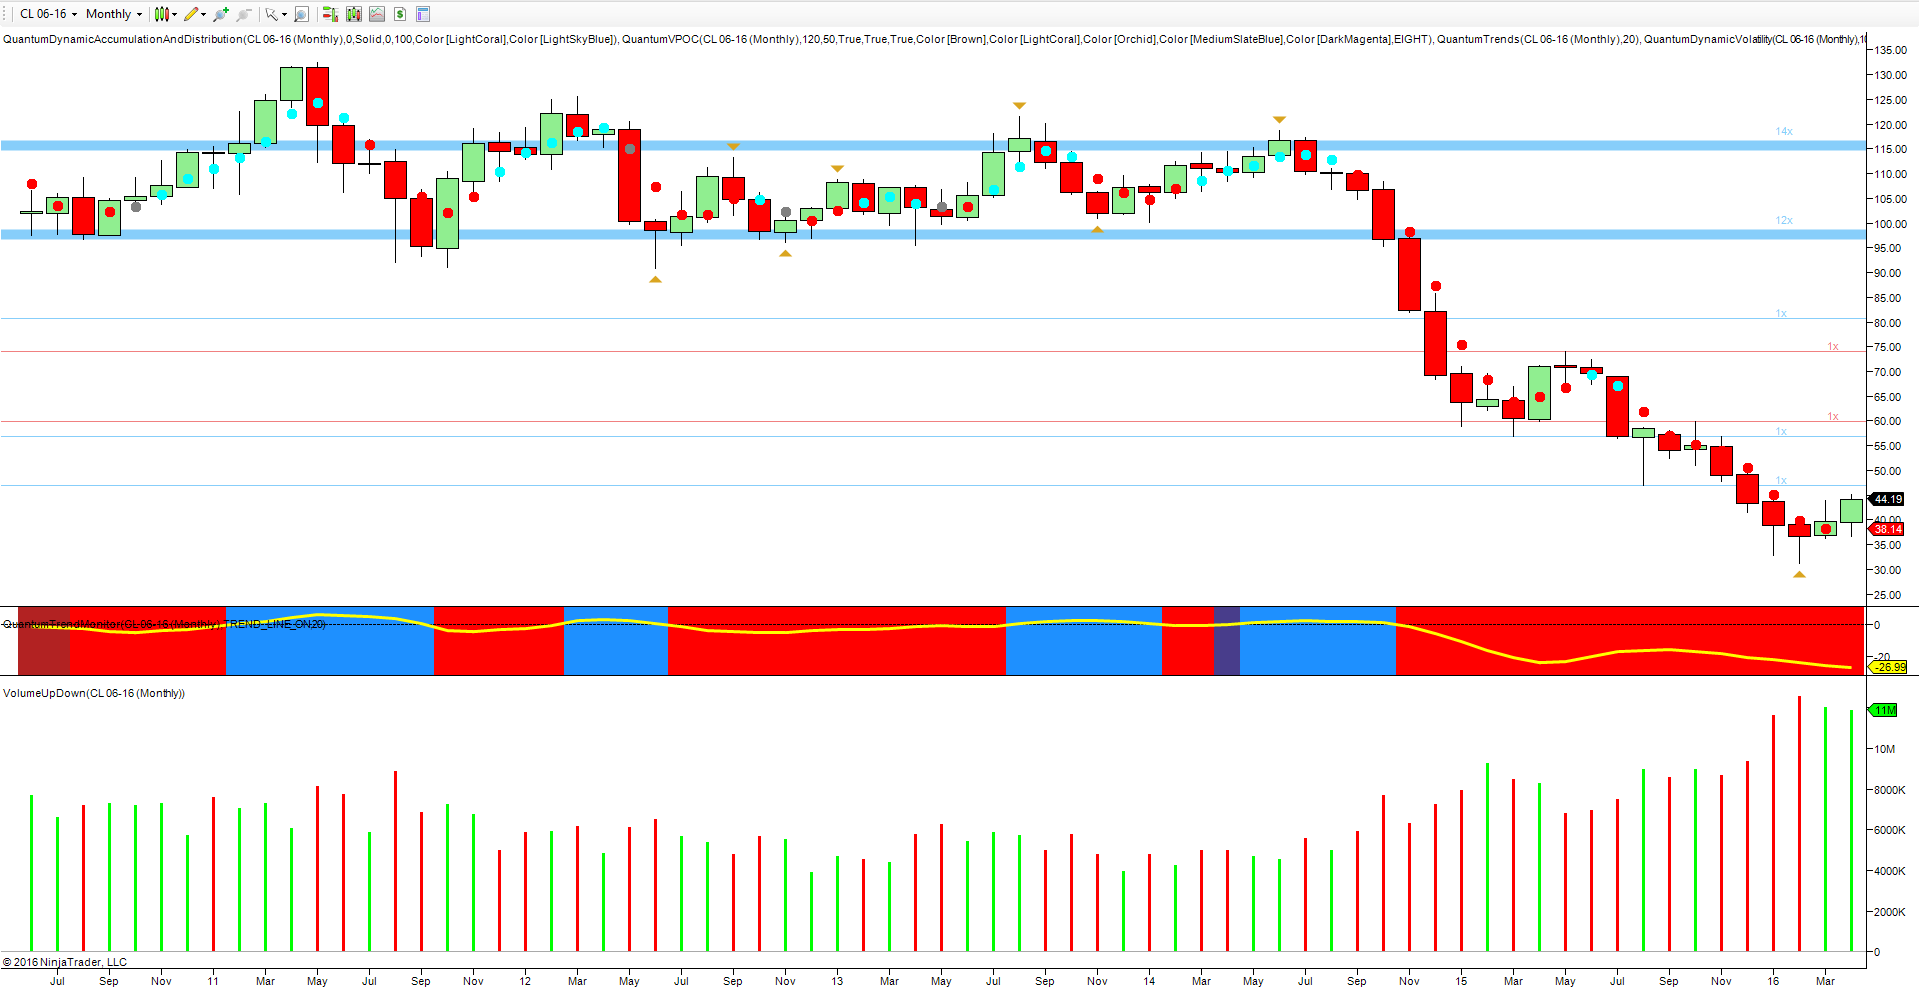
For longer term traders and investors in oil—as we come to the end of another month with the latest weekly oil inventories now posted—it is once again the weekly and monthly charts that provide insight and context for future trends. And if we start with the monthly chart, it was the stopping volume of January and February that has set the tone for the pause, and consequent reversal we are now seeing in the faster time-frames.
This indeed is a classic example of volume price analysis in action. The narrow spread price action, coupled with the ultra high volume simply reflected one thing – buying by the insiders, and something I highlighted at the time. The only question thereafter was whether oil prices would consolidate at this level, which is generally the case, or begin to rise gently.
To date it has been the latter, with volume rising and helping to push prices slowly higher. However, a cautionary note on this time-frame is the volume associated with March and April (to date) which is very high, and where we might have expected a more sustained move in price as a result.
This will no doubt unfold over the coming months, but it is a possible sign that all the selling pressure has yet to be absorbed, so we may yet see an extended congestion phase between $35 per barrel and $45 per barrel as a platform of support builds for the longer term.
Moving to the weekly chart, this helps to fill in some of the detail, with last week’s price action closing on a wide spread up candle on high volume, and confirming the bullish sentiment on this time-frame. In addition, oil duly took out the resistance level at $42 per barrel, closing the week well above at $43.73 per barrel. This level was tested again this week but held firm, with oil ticking higher to currently trade at $45.12 per barrel at time of writing.
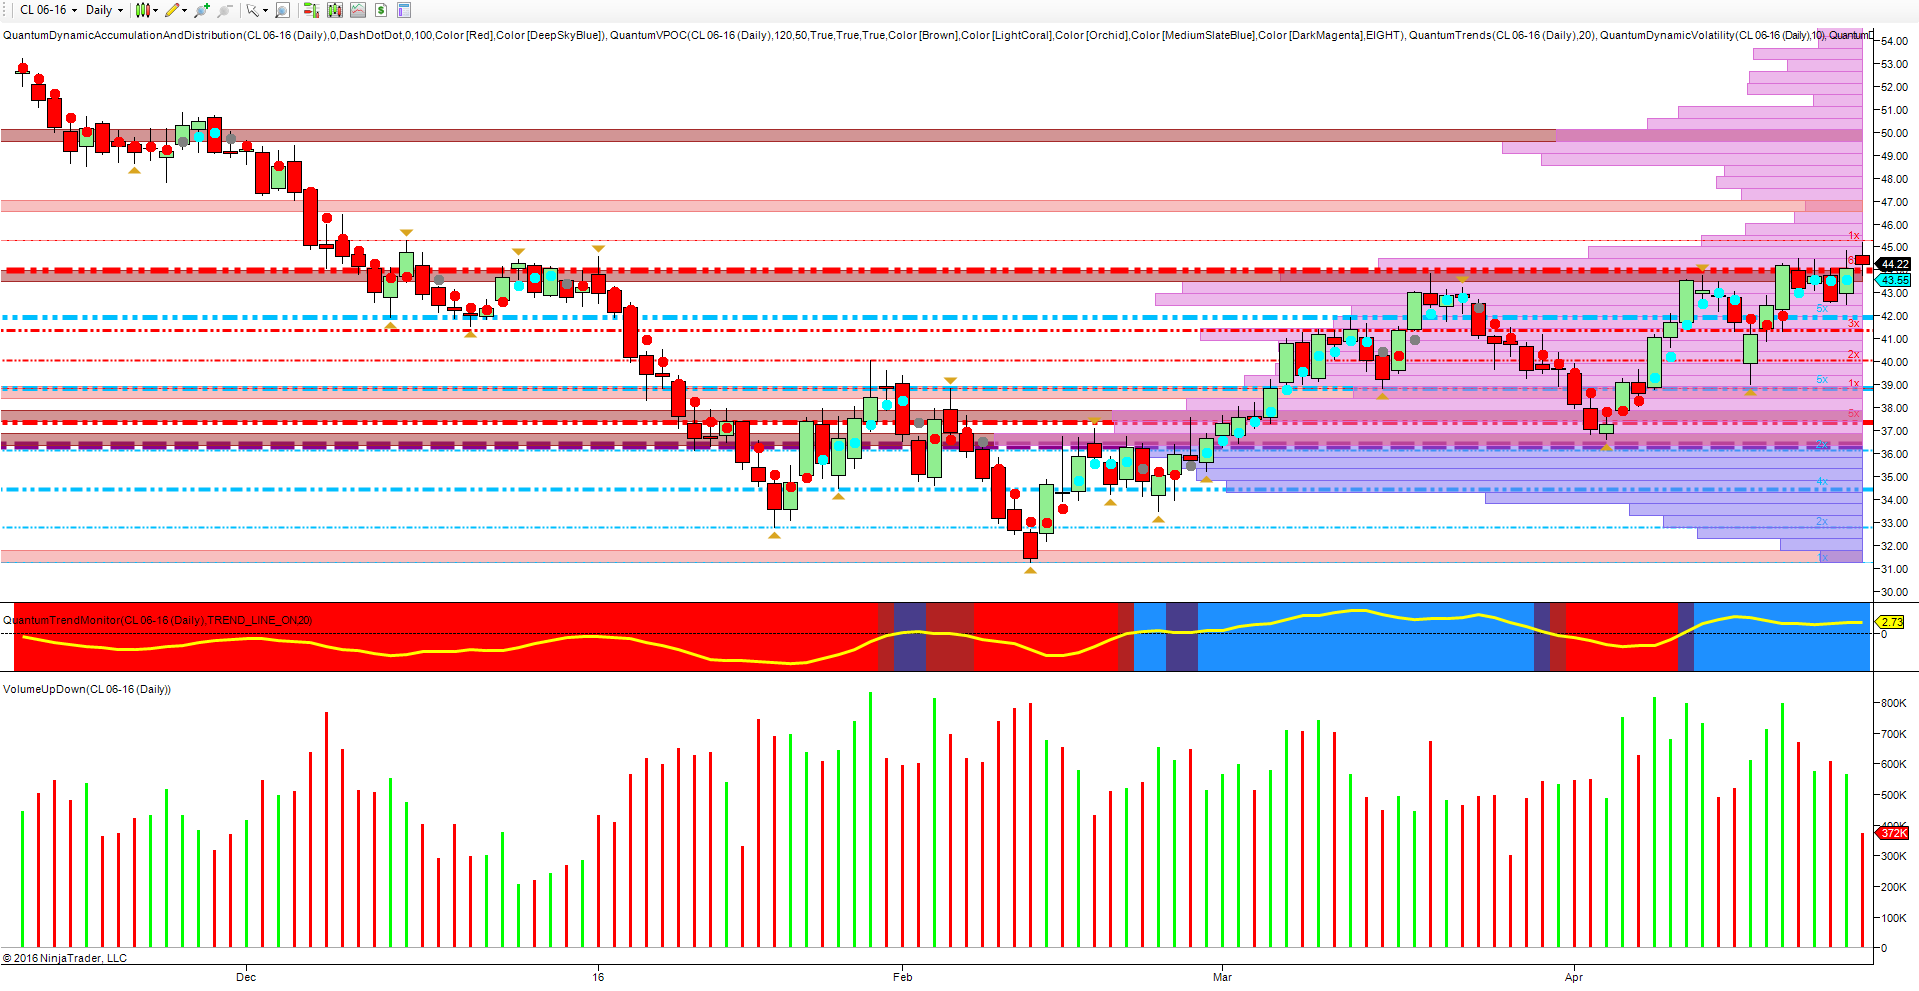
Finally to the daily chart. The significant level here is as defined by the accumulation and distribution indicator, with the red dotted line at $44 per barrel denoting the resistance area clearly signalled by the price action to the left of the chart. Yesterday’s price action saw this level breached with a gap up, but a gap that was duly filled.
However, should this support area remain firm the market then has a strong technical area to act as the springboard for a further move higher. The fundamental picture remains dominant, with OPEC, Iran and member states all playing a part, so anything is possible. Indeed with the Saudis now increasingly under pressure to borrow to shore up their losses from falling oil revenues, it is now a question of how much longer they and their members can continue to take the pain. Yesterday's oil inventories came in almost on target with a build of 2.0mbbls against a forecast of 1.4mbbls, which helped to cap further gains.
Oil prices are now eyeing the underside of resistance at the $47 per barrel region.


