Commodities suffered as the US dollar caught a bid into the month- and quarter-ends at the start of the week, though recovered slightly as the dollar gave back ground yesterday following disappointing US data. The agricultural sector was boosted by lower stockpiles and harvest forecasts.

Energy
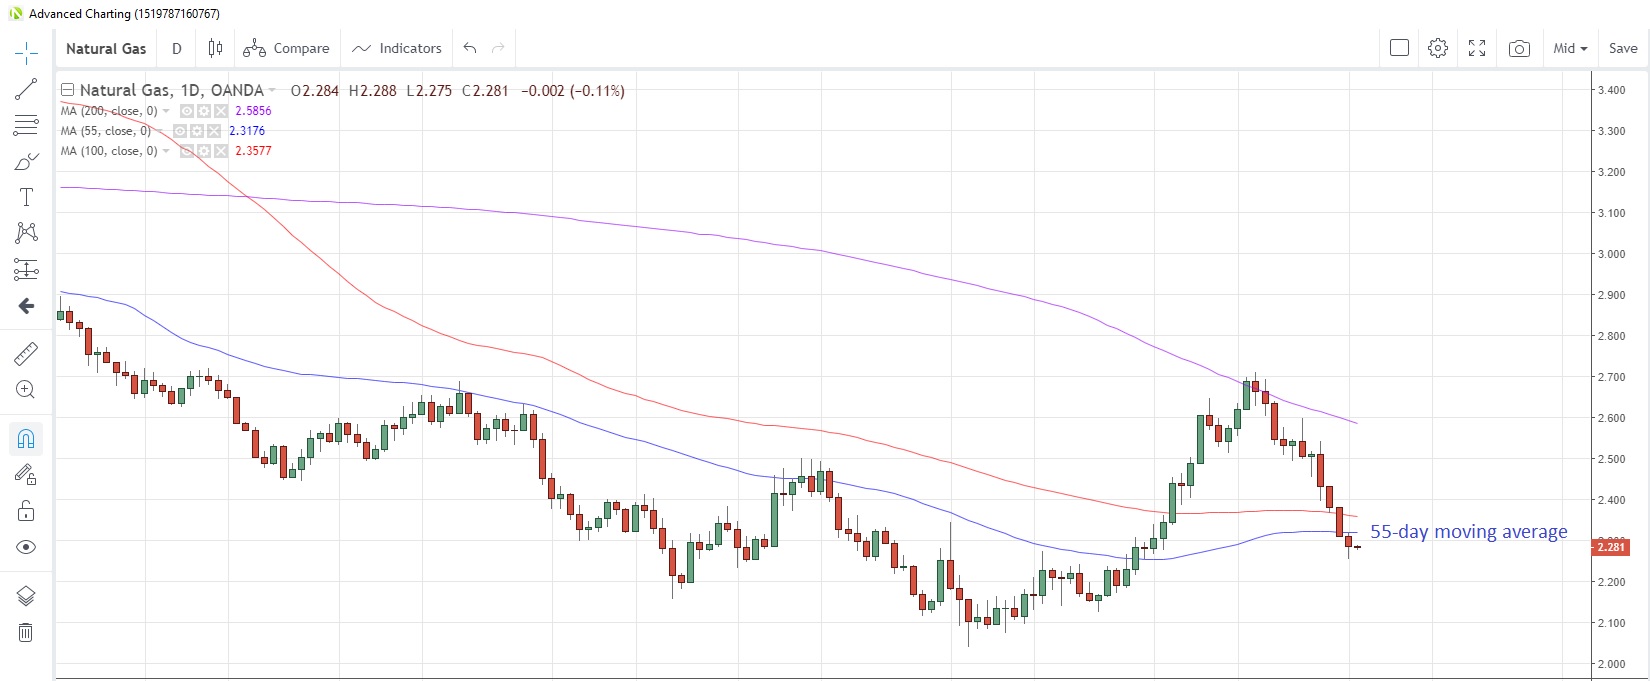
CRUDE OIL prices touched the lowest since September 3 yesterday, which is below the level from which WTI posted is biggest daily gain on record after attacks on Saudi Arabian production facilities. Saudi Arabia has since confirmed that it is back up to full production levels as of yesterday.Meanwhile, a recent Reuters survey suggests that OPEC output hit an eight-year low in September. Speculative investors were net buyers of the commodity in the week to September 24, the latest data snapshot from CFTC shows. NATURAL GAS prices have been sliding for the past four sessions, with the commodity reaching the lowest level since August 30 yesterday. The commodity closed below the 55-day moving average at 2.319 on Monday, the first time since August 28. Surging US production and a slackening in demand triggered by expectations for milder weather in the US Mid-west and East in the near future are keeping a lid on prices.The supply/demand mismatch is seeing gas stockpiles increasing, with the latest data from EIA as at September 20 showing an increase of 102 billion cubic feet (bcf). That’s the biggest weekly addition to inventories in 14 weeks. Forecasts for this week’s release due tomorrow show expectations of another 86bcf addition.Speculative accounts turned net sellers of natural gas for the first time in six weeks, according to the latest data as at September 24 from CFTC.
Natural Gas Daily Chart
Precious metals
GOLD was given a bit of a reprieve yesterday as the US dollar retreated and investors searched for safe haven assets after a disappointing US ISM manufacturing PMI print for September. Gold had touched the weakest in almost two months before rebounding, but still looks to be capped by the 55-day moving average at 1,490. That moving average had acted as a support for prices from end-May until last Monday. September was a bad month for gold as it fell 3.1%, bringing a four month rally to a halt.
Speculative investors remain bullish on the yellow metal however, boosting net long positions to the most since July 2016, according to the latest data from CFTC. Exchange-traded funds (ETFs) added to their gold holdings for an 11th consecutive day, Bloomberg reported yesterday. Russia’s finance ministry said yesterday that the country’s gold production rose 10.5% in the first six months of 2019 from a year earlier, hitting 135.33 tonnes.
SILVER also benefited from the dollar’s retreat yesterday, recovering from six-week lows to record its first up-day in six days. Speculative accounts reduced net long positions for a third straight week in the week to September 24, according to CFTC. Net longs are now at the lowest in three weeks. ETFs have been net buyers so far this year and, as of yesterday, year-to-date purchases have reached 103.3 million ounces.
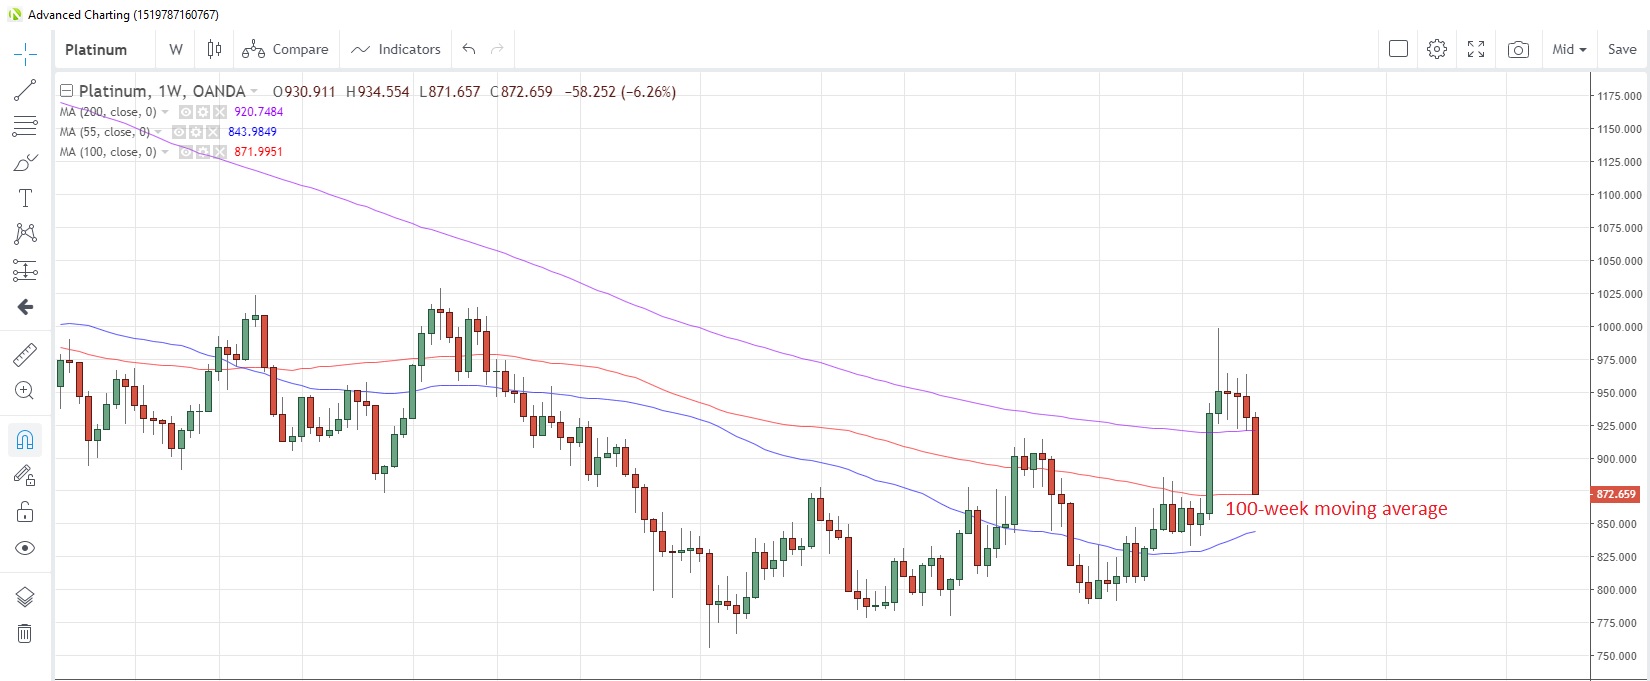
PLATINUM remains under pressure, unable to gain any traction from a weaker US dollar today. It hit the lowest level since August 28 this morning and is facing the biggest weekly loss since October 2016. The 100-week moving average at 871.99 is being tested for the first time since end-August. Speculative investors have been caught unawares by the latest drop as net long positioning is at its most bullish since March 2018.
Platinum Weekly Chart

PALLADIUM rose the most in three months in September, but October is proving to be a different story as the precious metal retreats from record highs above 1,700. Palladium has fallen for the past three days and the nearest possible support point could be the 23.6% Fibonacci retracement of the August-September rally at 1,626.70.
Speculative investors were well positioned for the move to record highs, having boosted net long positions for a fourth week to September 24, taking them to the highest in eight weeks.
Base metals
The weak US manufacturing PMI data pressured COPPER prices to the lowest in almost a month yesterday. The industrial metal is slightly higher today, hoping to snap the two-day losing streak. Speculative investors turned net sellers of the metal for the first time in three weeks, according to data to September 24 from CFTC.Chile announced that its copper production was up 11.1% y/y in August, the biggest jump since 2018, but it can partially be explained by maintenance work that was carried out in August last year.
Agriculturals
SOYBEANS are on track for the biggest weekly gain in three weeks after posting a 4.1% rally in the past two days. News that China is offering tariff waivers on some US imports together with lower US stockpiles and the prospect of tighter supply going forward are giving prices a lift. Wet weather in the US Mid-west is threatening to delay the US harvest.
Soybeans hit the highest level since July 15 yesterday, though the 55-day moving average at 8.671 looks poised to cross below the 100-day moving average at 8.666, which is often interpreted as a medium-term bearish signal.
Speculative accounts turned net bullish on the commodity for the first time since the week of July 23 after being net buyers for a second consecutive week, latest data from CFTC suggest.
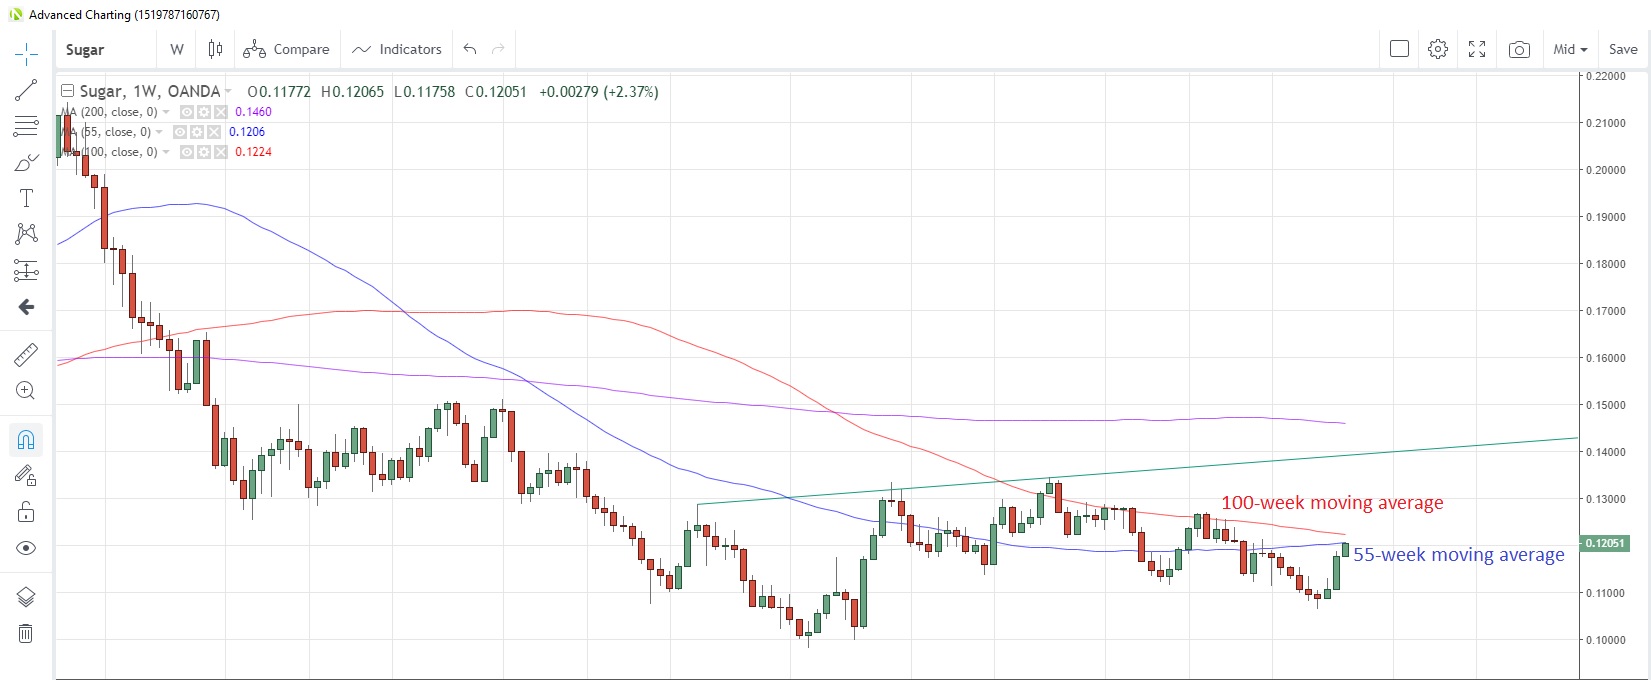
SUGAR likewise is enjoying a bull run amid concerns about tightening global supply. Estimates for the 2020/21 season suggest a shortfall of seven million tons. The commodity looks set to advance for a third consecutive week, the longest rising streak since June, and closed yesterday at 0.1205. There are a number of technical resistance points to the upside however. The 55-week moving average is at 0.1206, the 200-day moving average is at 0.1208 and the 100-week moving average is at 0.1224.
Sugar Weekly Chart

CORN prices are facing the biggest weekly gain since June this week after the US Department of Agriculture (USDA) released a lower-than-expected stockpiles report at the end of last week. Corn reached the highest since August 12 yesterday after opening above the 200-day moving average at 3.788 for the first time since August 13.
Speculative accounts were not positioned for this rally, having increased net short positions to the highest since the week of May 14. They have been net sellers for the past 10 weeks.
WHEAT has also benefited from the USDA report and prices have hit the highest in seven weeks this week. Speculative investors appear not to be convinced, and turned net sellers for the first time in three weeks in the week to September 24.
