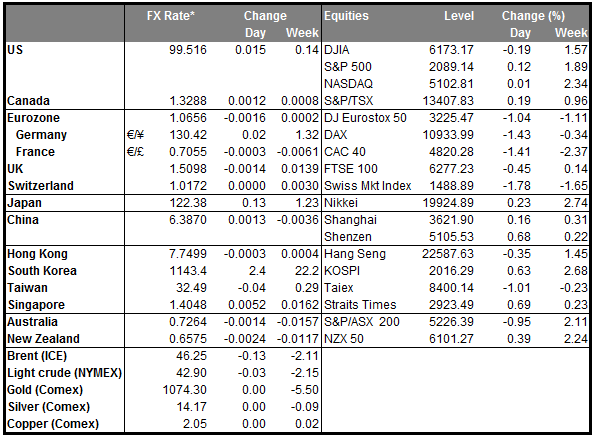
• Oil plummets below $28 US crude oil fell to its lowest level since September 2003, on concerns over a global supply flood. The International Energy Agency (IEA) said the global oil supply was set to last and that oil markets could “drown in oversupply”. On top of that, the recent end of sanctions on Iran, simply added to worries of an already oversupplied market. What's more, the Chinese President's trip on Tuesday to Saudi Arabia and later this week to Iran may put further downward pressure on oil prices, if these countries compete over oil sales share to their largest crude oil importer. Bearing this in mind, we could see oil prices heading even lower from their current level, and energy related currencies like CAD and NOK, to remain under selling interest.
• Overnight, New Zealand’s prices fell more than the market expected in the fourth quarter, adding pressure on the country’s central bank to ease further in the foreseeable future. Inflation fell 0.5% qoq in Q4 from +0.3% qoq in Q3, missing estimates of a 0.2% qoq decline. This leaves the annual rate hovering just above deflation at +0.1% yoy. Even though this may be not enough to prompt the RBNZ to cut rates at its next week meeting, with the inflation rate well below the Bank’s target range of 1%-3%, it definitely supports the case that interest rates will be cut this year. That said, as oil prices continue to decline and China slows down further, the weak New Zealand inflation expectations is set to keep the NZD under pressure.
• The highlight of the day will be the Bank of Canada monetary policy meeting. At their last meeting, Bank officials decided to keep the benchmark rate unchanged, but noted that cuts in resource-sector spending continued to weigh on business investment. These have led to significant job losses in energy-producing regions. Bearing in mind that oil prices have continued trading lower the last BoC meeting, and that Governor Poloz recently left the door open for further rate cuts, we expect the Bank to lower rates to support the softening economy in the foreseeable future, if not at this meeting. The implied market probability of a 25bps rate cut at this meeting soared to 73%. We also expect the Bank to maintain a dovish stance, and reiterate that the economy’s adjustment to the decline in the terms of trade is being aided by a weaker CAD and monetary easing. Given the extent of expectations for an easing, risks around the meeting are likely asymmetrical, with any disappointment likely to generate a bigger market reaction than the anticipated cut.
• As for the indicators, Canada’s manufacturing sales are forecast to have rebounded in November, though the market reaction on CAD is likely to be muted as investors focus may remain primarily on the policy meeting.
• From the UK, we get the employment report for November. The unemployment rate is forecast to have remained unchanged, while average weekly earnings are expected to have slowed further. In the minutes of their latest meeting, the BoE stated that the moderation in wage growth comes as a result of fewer hours worked, lower consumer inflation and workforce shifts to lower paid roles. The potential deceleration in average weekly earnings could push market expectations of a BoE hike even further back and put GBP under renewed selling interest.
• The US CPI data for December are also coming out. Both the headline and the core CPI rates are expected to have accelerated from the previous month. The December employment report showed that while the nonfarm payrolls figure surged, wage gains remained flat. This suggested that inflationary pressure from wages may have remained subdued during the month. Another factor that may have put downward pressure on prices could be the strong dollar, with import prices falling 1.2% in December. Furthermore, given that the PPI rate for the same month declined as oil prices continued to fall, we see a high likelihood for the CPI to accelerate less than expected. This could cause the dollar to give back some of its recent gains. Besides the CPI data, housing starts for December are forecast to have increased somewhat, while the more forward-looking building permits are expected to have declined. However, as these indicators are released at the same time as the CPI data, they will most likely have a secondary effect on the greenback.
• We have only one speaker on Wednesday’s agenda: Bank of Canada Governor Stephen Poloz will hold a press conference following the interest rate decision.
The Market
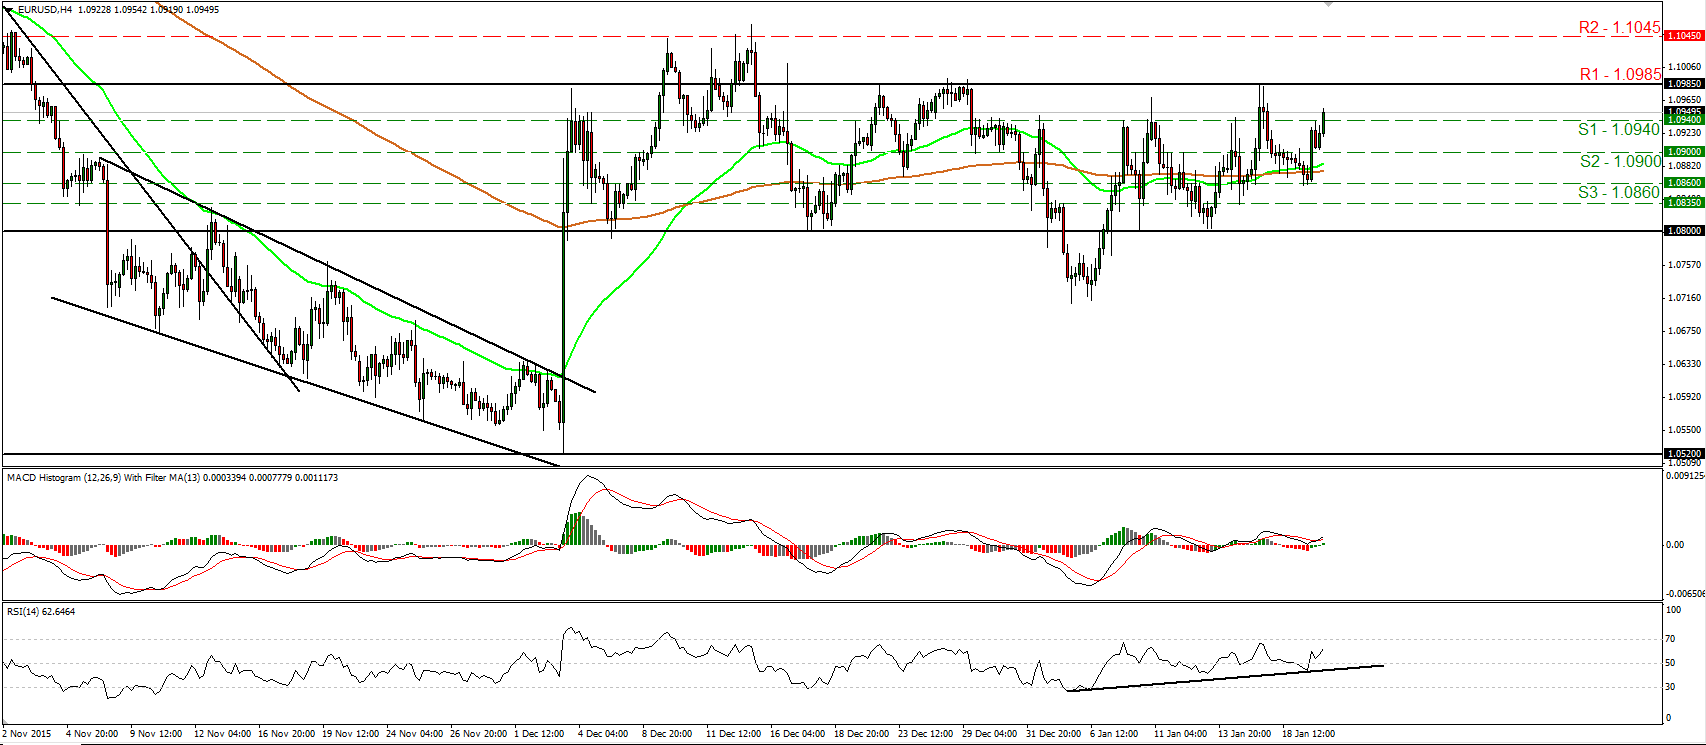
EUR/USD is headed towards 1.0985
• EUR/USD traded higher on Tuesday after it hit support at 1.0860 (S3). Subsequently, the rate emerged above two resistance (now turned into support) barriers in a row and now looks to be headed towards the key obstacle of 1.0985 (R1). Given that the pair has been oscillating between that resistance and the support zone of 1.0800, I would consider the short-term trend to still be to the sideways. I would prefer to see a decisive move above 1.0985 (R1) before assuming that the near-term outlook has turned somewhat positive. Something like that could initially aim for the 1.1045 (R2) resistance area. Our short-term oscillators reveal upside momentum and support the case that the pair could continue higher for a while, at least for a test at 1.0985 (R1). The RSI emerged back above its 50 line, while the MACD has bottomed slightly above zero and crossed above its trigger line. In the bigger picture, I will hold the view that as long as the pair is trading above the key support zone of 1.0800, the medium-term picture stays flat as well.
• Support: 1.0940 (S1), 1.0900 (S2), 1.0860 (S3)
• Resistance: 1.0985 (R1), 1.1045 (R2), 1.1100 (R3)
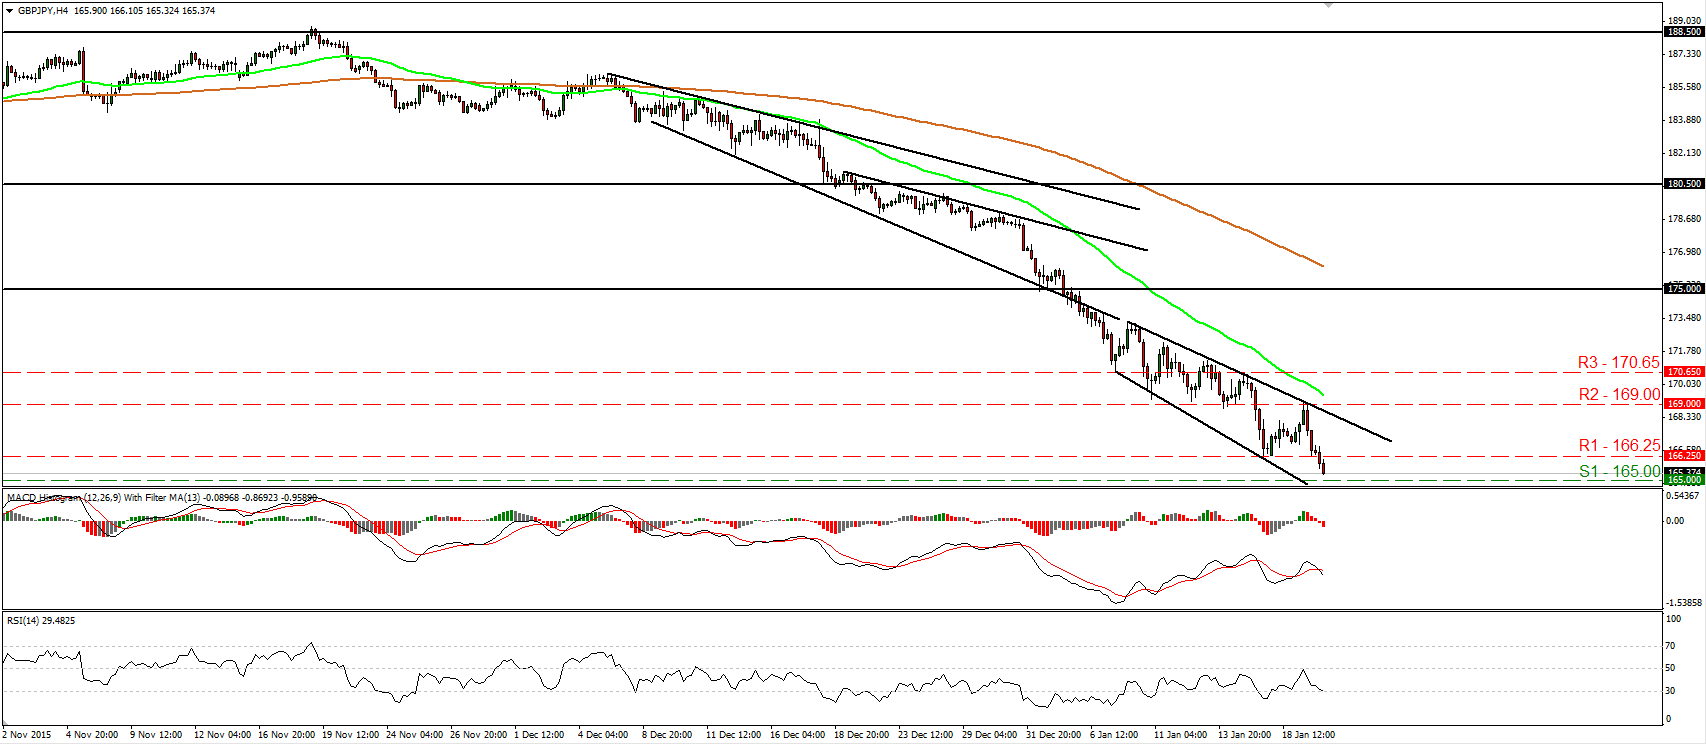
GBP/JPY looks ready to challenge the 165.00 line
• GBP/JPY plunged yesterday after it hit resistance at the 169.00 (R2) resistance zone and after BoE Governor Carney stated that now is not the time to raise interest rates. Today during the early European morning, the pair is headed towards the psychological zone of 165.00 (S1), and if the bears are strong enough to overcome it, I would expect them to initially aim for the 164.00 (S2) area. The price structure on the 4-hour chart still points to a downtrend, while our momentum studies detect downside speed and corroborate my view that the pair is poised to continue trading lower. The RSI slid after it found resistance at its 50 line. It now looks able to fall below 30, while the MACD, already negative, has topped and fallen below its trigger line. Zooming out to the daily chart, I see that on the 21st of December the rate fell below the 180.50 key hurdle, which is the lower bound of the wide range the pair had been trading since the 25th of August. Bearing that and that the rate is now trading below the psychological figure of 170.00, I would see a negative medium-term picture as well.
• Support: 165.00 (S1), 164.00 (S2), 162.00 (S3)
• Resistance: 166.25 (R1), 169.00 (R2), 170.65 (R3)
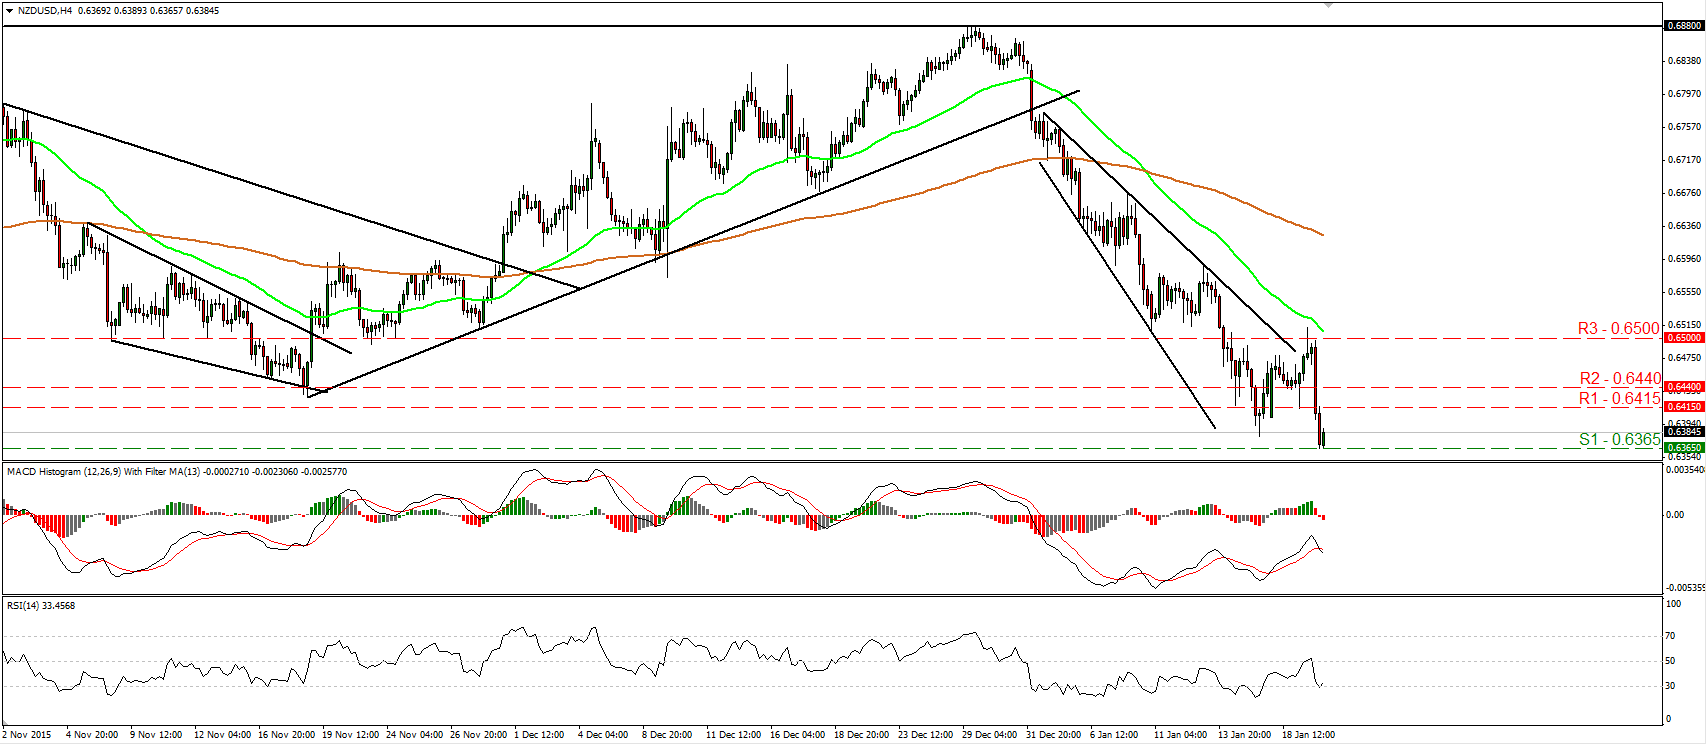
NZD/USD collapses following New Zealand’s CPI data
• NZD/USD collapsed yesterday after New Zealand’s CPI fell by more than anticipated in Q4. The pair hit resistance near the psychological zone of 0.6500 (R3) ahead of the release and as soon as the data were out, it plunged to hit support at 0.6365 (S1). On the 4-hour chart I still see a near-term downtrend and as a result, I would expect a clear move below 0.6365 (S1) to initially aim for the 0.6340 (S2) line, marked by the low of the 30th of September. Our short-term oscillators detect downside speed and support the continuation of the downtrend. The RSI edged down after it hit resistance slightly above its 50 line, while the MACD, already negative, has topped and fallen below its trigger line. However, the RSI rebounded somewhat from its 30 line and thus, I would be careful of a possible corrective bounce before the bears decide to shoot again. On the daily chart, I see that on the 7th of January, NZD/USD fell below the upside support line taken from the low of the 23rd of September. What is more, currently the pair is trading below the 0.6440 (R2) zone, something that confirms a forthcoming lower low on the daily chart. Therefore, I would consider the longer-term outlook to be negative as well.
• Support: 0.6365 (S1), 0.6340 (S2), 0.6300 (S3)
• Resistance: 0.6415 (R1), 0.6440 (R2), 0.6500 (R3)
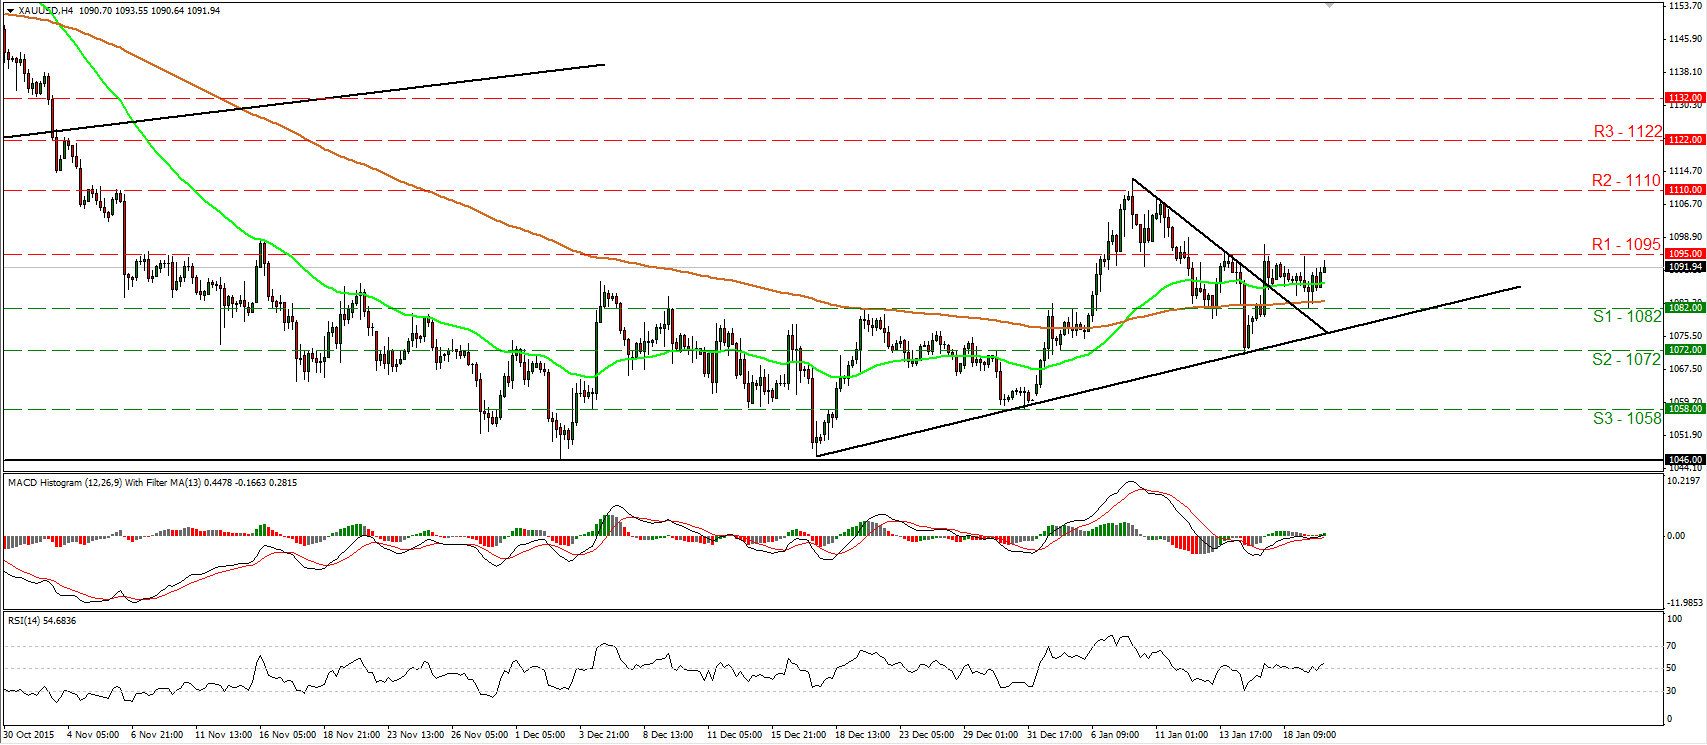
Gold rebounds from 1082
• Gold traded somewhat higher on Tuesday after it hit support at the 1082 (S1) line. During the European morning Wednesday, the metal is headed towards the 1095 (R1) resistance line, where a decisive break is likely to pull the trigger for the next resistance territory of 1110 (R2). Bearing in mind that the price is trading above the downtrend line taken from the peak of the 8th of January and above the uptrend line drawn from the low of the 17th of December, I would consider the short-term outlook to be positive. Taking a look at our short-term momentum indicators, I see that the RSI stands above its 50 line and points north, while the MACD, already above its trigger line, has just turned positive. These signs amplify the case that the yellow metal is possible to continue trading higher for a while. As for the broader trend, the metal formed a higher high on the 8th of January, near 1110 (R1). Then it printed a higher low on the 14th of the month. As a result, I still see a cautiously positive medium-term outlook.
• Support: 1082 (S1), 1072 (S2), 1058 (S3)
• Resistance: 1095 (R1), 1110 (R2), 1122 (R3)
WTI plummets below 28.40
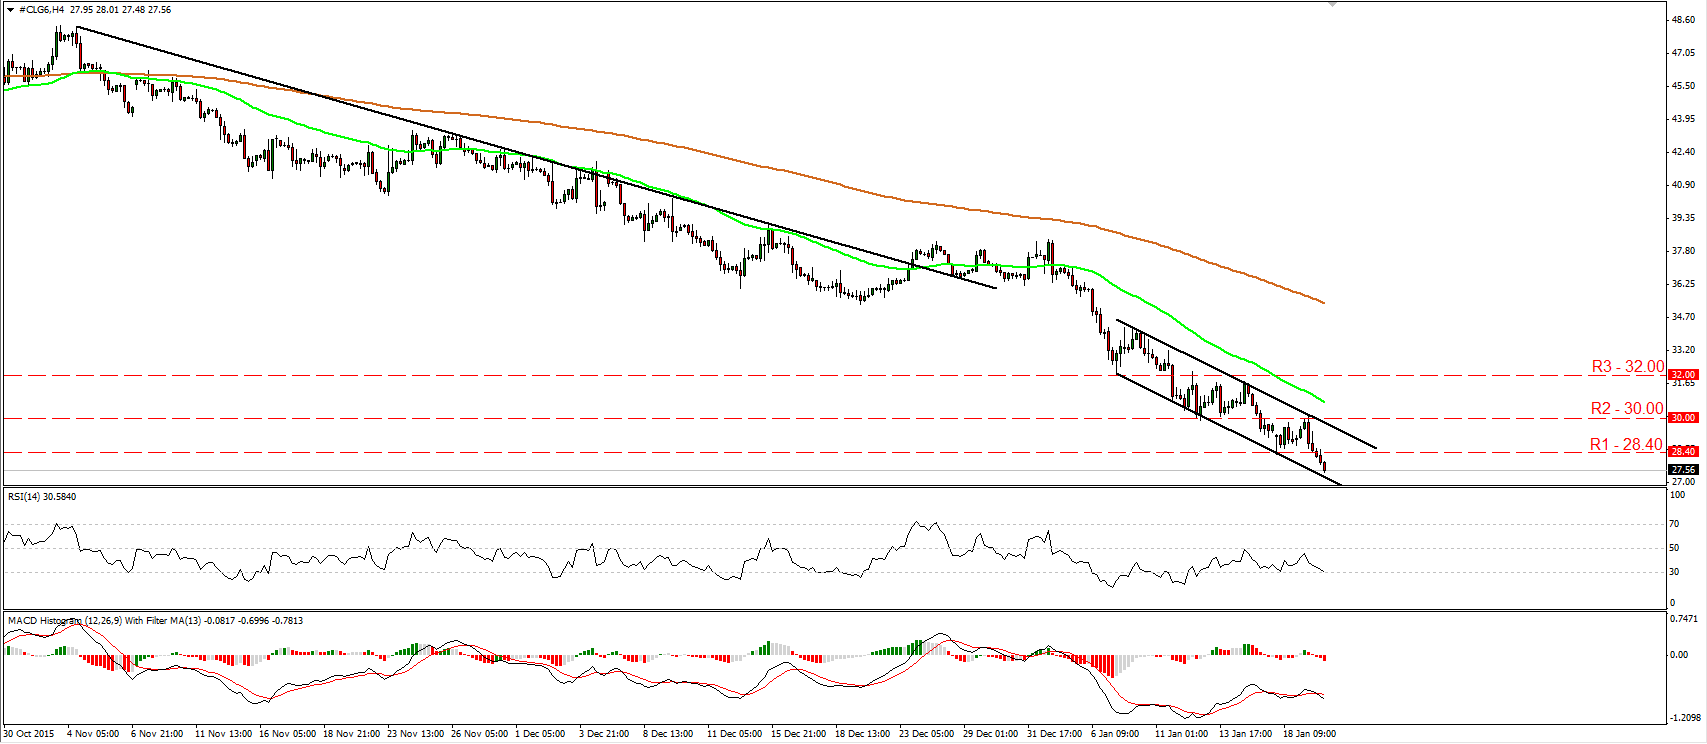
• WTI tumbled on Tuesday after it tested the psychological zone of 30.00 (R2) as a resistance. Subsequently, the price fell below the support (now turned into resistance) line of 28.40 (S1). The short-term trend remains negative in my view and therefore, I would expect the bears to maintain their momentum and aim for the 26. 85 (S1) support area. Looking at our short-term momentum studies, I see that the RSI slid after it hit resistance slightly below its 50 line and now looks ready to fall below 30, while the MACD, already negative, has topped and fallen below its trigger line. These indicators reveal strong downside speed and magnify the case for further declines. On the daily chart, I see that WTI has been printing lower peaks and lower troughs since the 9th of October. As a result, I would consider the longer-term picture to stay negative as well.
• Support: 26.85 (S1), 25.00 (S2), 24.00 (S3)
• Resistance: 28.40 (R1), 30.00 (R2), 32.00 (R3)

