Oil had shot higher until recent days, gaining about $11 a barrel in two weeks, fed by a mix of physical and market sentiment pressures. US market and oil industry news and trends have had an undue influence on the process – underlining one major cause of rising oil prices - the US focus for major changes of market perception, symbolized by the near total disappearance of the Brent oil premium against US WTI grade oil. As recently as February this year, Brent grade oil was priced at $22 a barrel above WTI, supposedly reflecting major supply-demand differences between WTI, the western hemisphere benchmark, and Brent oil, the eastern hemisphere benchmark.
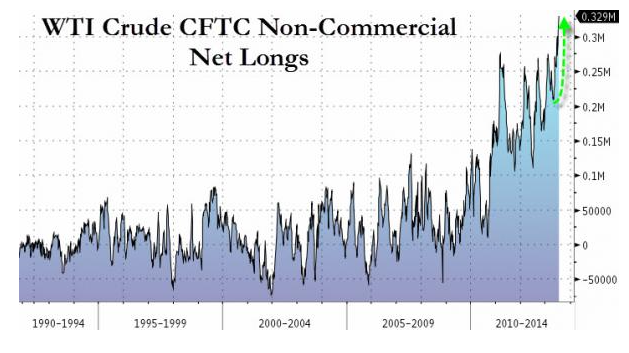
Like the premium, which disappeared almost without a trace in a few weeks' trading, speculators are now pulling back from their bullish bets on oil of any grade or type. Data from the US CFTC commodities trading watchdog agency (below from Bullandbearmash) shows the huge recent rise in “net long” positions – speculators betting on continued rising prices - in the US market. This trend is now reversing.
NO FUNDAMENTALS
In an interesting and overdue symmetric process, net short positions on gold – speculators betting for a continued fall of gold prices – have dramatically shrunk in recent days. As Bloomberg reported on 21 July:
“Gold surged 6.7 percent ….. Speculators increased their net-long position by 56 percent to 55,535 futures and options contracts by July 16, the highest since June 4, U.S. CFTC data show”.
In both cases – speculating against gold and for oil – this was “fundamentals free” betting with a necessarily short shelf life and early best-by date.
The physical gold supply-demand picture basically only concerns a small market – world annual fresh mine output gives about 0.3 grams a year for each person on the planet – but the world oil market handling about 51 million barrel a day (Mbd), and total production of about 89.75 Mbd makes for a world average of about 630 kilograms a year consumed for each person on the planet. For gold, this makes it much easier to arrive at a situation similar to the one we have today – physical demand for gold can easily and totally outstrip supply. This is bullish for prices. For oil, the potential for oversupply, or insufficient demand and therefore falling prices is much higher.
Over months rather than weeks, the oil outlook reports from all sources, including the US IEA, the IEA, the OPEC Secretariat, the Economist Intelligence Unit, major banks and brokers all came in bearish for oil. "There is little evidence that the stronger U.S. economy is leading to a recovery in US oil demand," the Economist Intelligence Unit concluded last week. As noted by myself, Egyptian and Syrian geopolitical risk and North African political instability among the very few outright-positive tailwinds for oil prices. When or if this often exaggerated risk fades, there will be very few support pillars for the oil market in Q2 2013, the second half of this year.
Here we have another reason for the rush to talk up oil – making hay while the sun shines. Without a serious net aggravation of Middle Eastern instability, $80 a barrel for both Brent and WTI is generous.
REAL WORLD FUNDAMENTALS
Most analysts look only at the large and continuing growth of US oil production and ever-diminishing net oil imports. This ignores the rest of the world, both the supply side and demand side. The Paris-based IEA has on several occasions said that its expectations and forecasts for 2014 should give the oil bulls "some cause for alarm”. Conservatively estimated, the surge in non-OPEC non-US oil output may exceed 1.3 Mbd in 2014, but other estimates go above an addition of 1.5 Mbd.
The more optimistic demand forecasts for world oil demand growth – coming from the IEA, as well as OPEC – suggest growth in demand of 1.2 Mbd in 2013-2014 is about as high as can be expected.
Staying with the IEA, which uses IMF forecasts for world economic growth – and we know what happens to IMF growth forecasts on a regular basis - the latest monthly oil market report from the IEA claims that by Q3 this year, world economic growth will start picking up, also lifting world oil demand. This is not a rational forecast at present. Pushing the pick-up in economic growth to early 2014, or later, is more rational or less fanciful, which makes the IEA's present forecast of world oil demand growth in 2013-2014 of 1.2 Mbd highly optimistic.
In the US and Europe, as well as Japan, South Korea, Australia – in fact OECD wide - “peak oil” now means peak demand - a rearview picture of previous peak demand. The European Union, to be sure in major part due to recession and deindustrialization, has entered its seventh straight year of oil demand decline. In the US, due to an equal balance of oil saving and recession, as well as delocalization and industrial change, oil demand has for optimists “only flat lined”. It has not recovered 2007 demand levels using EIA data, here.
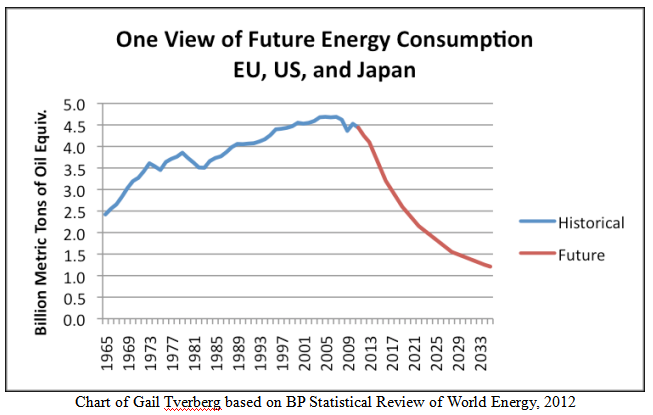
Major oil industry players (below BP) have for a mix of reasons including their own financial strategies, as well as projections and forecasts for alternate energy development, and forecasts of changed economic structures, increasingly published outlooks for a sharp continuing decline of oil in the energy mix, and the energy intensity of the economy. In this case, the decline is about 70% by 2035. 
THE MAJOR ROLE OF IMPORTS
World oil import demand is a key driver of prices and price sentiment. It is often treated as a dummy for national consumption but this ignores world refinery trade. Specific countries for example Singapore, a refining hub for Asia Pacific, imported around 2.8 Mbd in 2011 but only consumed about 1.15 Mbd. The rest was re-exported.
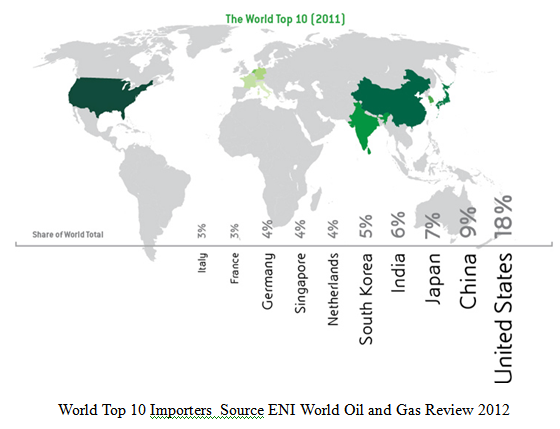
The world's 10 major importers – defined as taking 3% or more of world imports – are shown below using ENI data. These importers take about 63% of imports, and the biggest 5 take 45% of world total imports. Of these top importers, six are reducing their draw on world export supply, led by the US whose net imports for domestic consumption (after refining trade re-exports), by value on a seasonally adjusted basis, fell to its lowest level since 2011 in April, according to US Commerce Department data. In terms of gross volume of imported oil however, this was the lowest level of imports since 1995.
In July, Clarkson Plc, the leading tanker shipbroker forecast that US seaborne imports will decline 11% on the year to a year-average of 5.4 Mbd in 2013, the largest slide since 1991. For the world oil shipping industry this is somber news. It is only in the very short-term buffered by purely speculative-driven stockage of unsold crude in tankers, marginally raising ship rates for Suezmaxes, the hardest-hit, smallest category among large-sized tankers able to haul cargoes of 1-million-barrels or more. Recent and impressive growth of US refining capacity and re-exports of refined products has considerably slowed for several key export markets since 2011 or before, making it unlikely this US-source world import demand can hold up.
Other major refiners including Singapore, the Netherlands and Japan will also tend to decline, or continue their existing trend of decline, for oil imports. 
Unexpected to some, and completely unthinkable before 2009, July trade data from China showed its crude imports contracted in the first-half of 2013 compared with one year previous. Apart from underlining the pace of China's economic rebalancing - when added to the sharp decline of India's oil import growth to small single digit annual percentage rates – this raises the prospect that the world's major oil importer nations have all, sometimes for different reasons, entered into decline. The paradigm is firstly slow growth, then zero growth, then net decline in volume.
Expecting oil prices to grow, in the face of these supply-demand fundamentals, is an excellent example of pure speculative faith. How long the faith holds together is uncertain – but it is not eternal.
- English (UK)
- English (India)
- English (Canada)
- English (Australia)
- English (South Africa)
- English (Philippines)
- English (Nigeria)
- Deutsch
- Español (España)
- Español (México)
- Français
- Italiano
- Nederlands
- Português (Portugal)
- Polski
- Português (Brasil)
- Русский
- Türkçe
- العربية
- Ελληνικά
- Svenska
- Suomi
- עברית
- 日本語
- 한국어
- 简体中文
- 繁體中文
- Bahasa Indonesia
- Bahasa Melayu
- ไทย
- Tiếng Việt
- हिंदी
Oil Net Longs Now Going Short
Latest comments
Loading next article…
Install Our App
Risk Disclosure: Trading in financial instruments and/or cryptocurrencies involves high risks including the risk of losing some, or all, of your investment amount, and may not be suitable for all investors. Prices of cryptocurrencies are extremely volatile and may be affected by external factors such as financial, regulatory or political events. Trading on margin increases the financial risks.
Before deciding to trade in financial instrument or cryptocurrencies you should be fully informed of the risks and costs associated with trading the financial markets, carefully consider your investment objectives, level of experience, and risk appetite, and seek professional advice where needed.
Fusion Media would like to remind you that the data contained in this website is not necessarily real-time nor accurate. The data and prices on the website are not necessarily provided by any market or exchange, but may be provided by market makers, and so prices may not be accurate and may differ from the actual price at any given market, meaning prices are indicative and not appropriate for trading purposes. Fusion Media and any provider of the data contained in this website will not accept liability for any loss or damage as a result of your trading, or your reliance on the information contained within this website.
It is prohibited to use, store, reproduce, display, modify, transmit or distribute the data contained in this website without the explicit prior written permission of Fusion Media and/or the data provider. All intellectual property rights are reserved by the providers and/or the exchange providing the data contained in this website.
Fusion Media may be compensated by the advertisers that appear on the website, based on your interaction with the advertisements or advertisers.
© 2007-2025 - Fusion Media Limited. All Rights Reserved.
