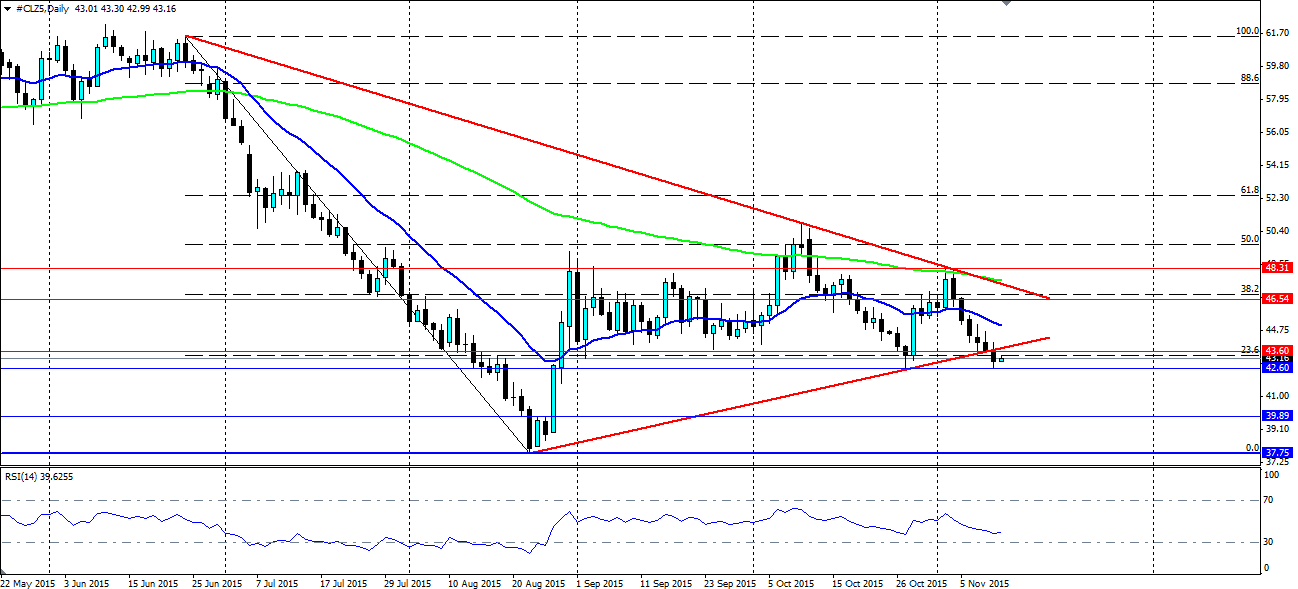
WTI Crude Oil looks to have extended lower out of the bullish trend line that formed a large consolidation pattern. If the breakout holds, it could spell disaster for the Oil bulls and the six year low at $37.75 a barrel could come under pressure.

Oil has fallen steadily over the last week or so thanks to a strong rejection off the bearish trend line that forms the upper boundary of a large consolidation pattern. The bearish trend stretches back to the high in June, when the bullish bounce in the commodity came to an abrupt end. Last week’s test of the trend line was the second major test of this trend and it held almost to the tick. That test also coincided with resistance at $48.31.
On the fundamentals front, there had been some hope that supply would be curtailed with OPEC meeting, a strike in Brazil and the shutting of one of Libya’s ports. But as we have seen time and time again over the course of this year, any market optimism regarding supply is given a swift reality check. The API crude inventories gave the market yet another reality check this week as they returned another solid build of 6.3 million barrels. What is also interesting is that imports were up along with refinery runs, which rose to 193k bpd, showing the glut of oil at all levels through the system.
The market has a very bearish outlook for oil at the moment and it’s not just down to the fundamentals. The technicals also support a case for further losses. The monthly low at $42.58 was put under pressure in trading yesterday. This comes after a break of the dynamic support along the short term bullish trend line. We could see a slight bounce up to the trend line, but it will now act as dynamic resistance and will give the market a point of entry for a short position, especially with the break of the solid support at $43.60.
The support at $43.60 (that will now act as resistance) was very close to the 32.6% Fibonacci level from the bearish extension seen after June this year. It had held up the bottom of the sideways consolidation through September and October and was looking rather solid. Yesterday’s close below this level certainly adds weight to the case for a bearish extension towards the six year low at $37.75.
The moving averages (20 and 100 EMAs) have both begun to accelerate in a bearish fashion. Thanks largely to the rejection off the 100 day MA and the bearish trend line at $48.31 last week. The RSI is interesting as it has not yet pushed into oversold, despite the clear bearish sentiment. This allows for further falls before the market will react to support oil. Support for an extension lower is found at $42.60, $39.89 and the six year low at $37.75 a barrel. If oil can muster support and gain some ground back, look for resistance at $43.60, 46.54 and last week’s top at $48.31.
